February 19, 2026


Reddit ads reporting provides the data you need to evaluate performance, optimize campaigns, and demonstrate ROI. But the dashboard offers dozens of metrics—which ones actually matter depends on your objectives.
This guide covers the key metrics for each campaign type, how to build useful reports, and common reporting mistakes to avoid.
Reddit Ads Manager provides:
Create custom reports by:
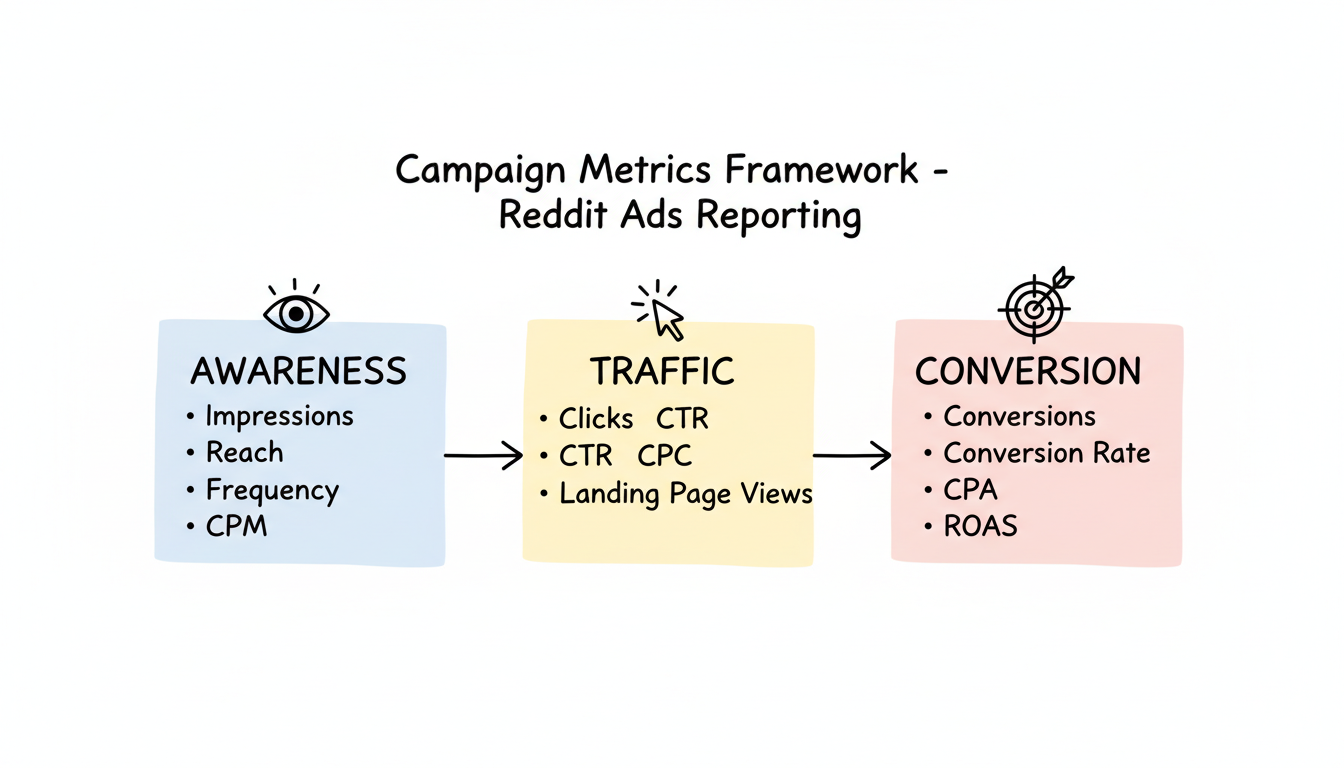
Focus on reach and frequency metrics:
Metric | Description | What Good Looks Like |
Impressions | Times your ad was displayed | Volume depends on budget |
Reach | Unique users who saw your ad | Higher = broader audience |
Frequency | Average times each user saw ad | 2-4 for awareness, avoid 10+ |
CPM | Cost per 1,000 impressions | $2-8 on Reddit |
Video Views | Started video plays | Compare to impressions |
Video Completion Rate | Viewers who watched to end | 25%+ is solid |
Focus on engagement and click metrics:
Metric | Description | What Good Looks Like |
Clicks | Ad clicks | Volume depends on budget |
CTR | Click-through rate | 0.5-2% typical; 2%+ excellent |
CPC | Cost per click | $0.50-$2.00 typical |
Landing Page Views | Clicks that reached your page | Should be close to clicks |
Bounce Rate | Single-page visits (in GA) | Under 60% |
Focus on outcome metrics:
Metric | Description | What Good Looks Like |
Conversions | Completed actions | Depends on volume/offer |
Conversion Rate | Conversions / clicks | 2-5% typical; varies by offer |
CPA | Cost per acquisition | Below your target threshold |
ROAS | Return on ad spend | 2x+ for e-commerce |
Value | Total conversion value | Track if passing values |
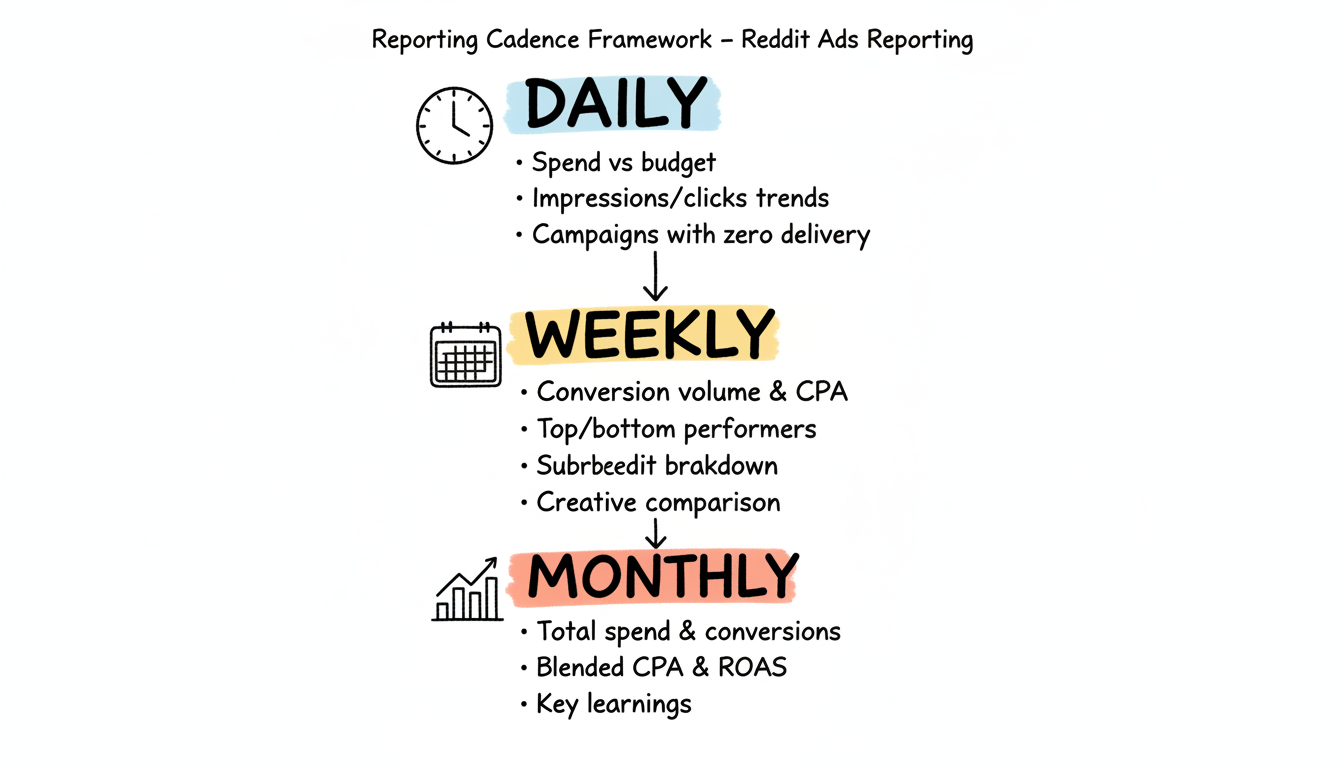
For daily checks, track:
Quick daily scans catch delivery issues before they waste significant budget.
For weekly analysis:
Weekly reports inform optimization decisions without overreacting to daily noise.
For stakeholder reporting:
Focus on business outcomes, not granular metrics executives don't need.
See which communities drive results:
Subreddit breakdowns often reveal that 20% of communities drive 80% of conversions. When analyzing Reddit ads cost per click, subreddit-level data helps you identify which communities deliver the most efficient performance.
Compare mobile vs. desktop performance:
Compare feed vs. conversation placements:
Analyze trends over time:
Making changes based on small sample sizes leads to random optimization, not improvement.
Guideline: Wait for 50+ conversions before concluding which ad groups or creatives perform best. For statistical significance, use A/B testing calculators.
If your attribution window is 7 days, conversions from clicks in the last 7 days aren't fully counted yet.
Guideline: When analyzing conversion data, exclude the most recent attribution window period. For 7-day click attribution, analyze data ending 7+ days ago.
Comparing a holiday week to a regular week, or a week with budget changes to a stable period, produces misleading conclusions.
Guideline: Compare like to like. Use year-over-year comparisons for seasonal adjustments. Note any budget, targeting, or creative changes.
Reddit reports what Reddit tracks. Conversions influenced by Reddit but completing through other channels won't appear.
Guideline: Supplement with Google Analytics, your CRM, and multi-touch attribution tools for complete picture.
Impressions and CTR feel good but don't pay bills. Celebrating high CTR while ignoring negative ROAS leads to poor decisions.
Guideline: Always connect metrics to business outcomes. High CTR with high CPA means the wrong people are clicking. Consider working with a best Reddit marketing agency to ensure you're focused on metrics that drive real business results.
Download report data for:
For automated reporting:
Connect Reddit data to:
For those using specialized Reddit advertising tools, integration capabilities can streamline your reporting workflow and provide deeper insights across platforms.
Daily checks for delivery health (spending, impressions). Weekly deep-dives for performance analysis and optimization decisions. Monthly summaries for stakeholder reporting and strategic review. Avoid making optimization changes based on less than 7 days of data.
Reddit CTR typically ranges from 0.5% to 2%. CTR above 1% is solid; above 2% is excellent. However, CTR varies significantly by industry, creative format, and targeting. Native-looking creative tends to drive higher CTR. Always prioritize conversion metrics over CTR.
Common causes: different attribution windows (Reddit 7-day vs. GA last-click), cross-device gaps, ad blocker interference, and UTM parameter issues. To reconcile: ensure UTM parameters are properly appended, compare with consistent attribution windows, and accept some variance as normal.
By submitting this form, you agree to our Privacy Policy and Terms & Conditions.


