February 19, 2026


This TikTok app install case study examines how a fitness app scaled user acquisition through TikTok advertising, achieving over 50,000 installs in 60 days while maintaining a cost per install (CPI) well below industry benchmarks. The campaign demonstrates how creative strategy and platform-native content can drive efficient mobile app growth.
FitTrack Pro (name changed for client privacy) is a subscription-based fitness tracking app targeting health-conscious users aged 18-34. The app offers personalized workout plans, nutrition tracking, and progress analytics.
Pre-Campaign Metrics:
Challenge: Rising CPIs on Meta and increasing competition in the fitness app category prompted the team to explore alternative acquisition channels. According to industry data from MobileAction, CPIs typically range from $1.50-$3.00 for mid-range apps and can exceed $3.00-$6.00 for competitive iOS categories.
The marketing team set a goal: prove TikTok as a viable acquisition channel with CPIs under $2.50 while maintaining quality metrics comparable to existing channels.
FitTrack Pro faced several obstacles entering TikTok advertising:
The team's existing ad creative consisted of polished, product-focused videos optimized for Instagram and Facebook. According to TikTok marketing strategy research, brands that succeed on TikTok blur the line between advertising and organic content—a significant shift from their current approach.
While TikTok's demographics skewed younger than Meta, the team needed to confirm whether fitness content would resonate. Data showed TikTok adoption growing across all age groups, with 57% of 25-34 year olds and 44% of 35-44 year olds now active on the platform in 2025.
iOS 14.5+ privacy changes complicated measurement. The team needed to establish tracking through an MMP (AppsFlyer) while accounting for SKAdNetwork limitations.
Initial test budget: $15,000 over 30 days. With an unknown CPI, the team needed to demonstrate viability quickly before securing additional investment.
The campaign strategy centered on four pillars:
Competitive Analysis:
Technical Setup:
Audience Strategy: Based on scaling research, the team chose broad targeting for initial tests, allowing the algorithm to find efficient audiences. Targeting parameters:
Content Approach: Rather than adapting existing Meta creative, the team developed TikTok-native concepts:
Creative Type | Description | Hypothesis |
Transformation UGC | Before/after user stories | Social proof drives installs |
Tutorial style | Quick workout demonstrations | Value-first earns attention |
Problem/solution | "Struggle with consistency?" hooks | Addresses pain points |
Trending audio | App features over popular sounds | Platform native feel |
Testing Framework:
As data accumulated, the team identified winning patterns:
What Worked:
What Didn't Work:

The winning creative formula combined several elements:
According to marketing data, the first 3 seconds determine whether users engage. The team tested multiple hook styles:
Best Performing Hooks:
Element | Specification | Rationale |
Format | 9:16 vertical | Full-screen immersion |
Length | 21-34 seconds | Optimal completion rate |
Audio | Trending sounds + voiceover | Platform native |
CTA | "Link in bio" + direct | Split tested |
The team partnered with 6 micro-influencers (10K-50K followers) for authentic content:
According to TikTok influencer marketing agencies, micro-influencers typically charge $500-$2,000 for branded content, making this approach cost-effective for creative production.
Metric | Target | Actual | vs Target |
Total installs | 25,000 | 52,847 | +111% |
Average CPI | <$2.50 | $1.80 | -28% |
CTR | 1.0% | 1.6% | +60% |
D7 retention | 25% | 31% | +24% |
Trial starts | 15% | 18.5% | +23% |
Total spend | $15,000 | $28,500* | +90% |
*Budget increased after Week 3 based on performance.
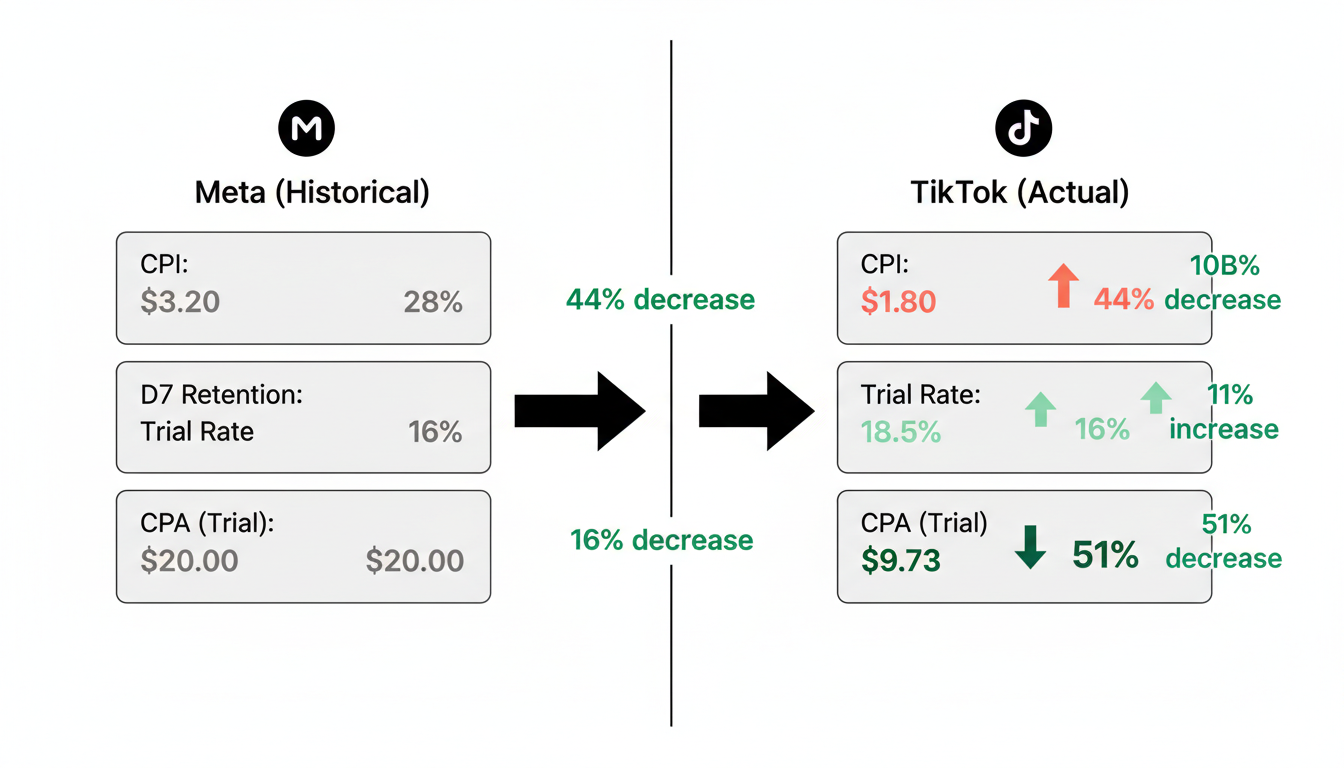
Metric | TikTok | Meta (Historical) | Difference |
CPI | $1.80 | $3.20 | -44% |
D7 retention | 31% | 28% | +11% |
Trial rate | 18.5% | 16% | +16% |
CPA (trial) | $9.73 | $20.00 | -51% |
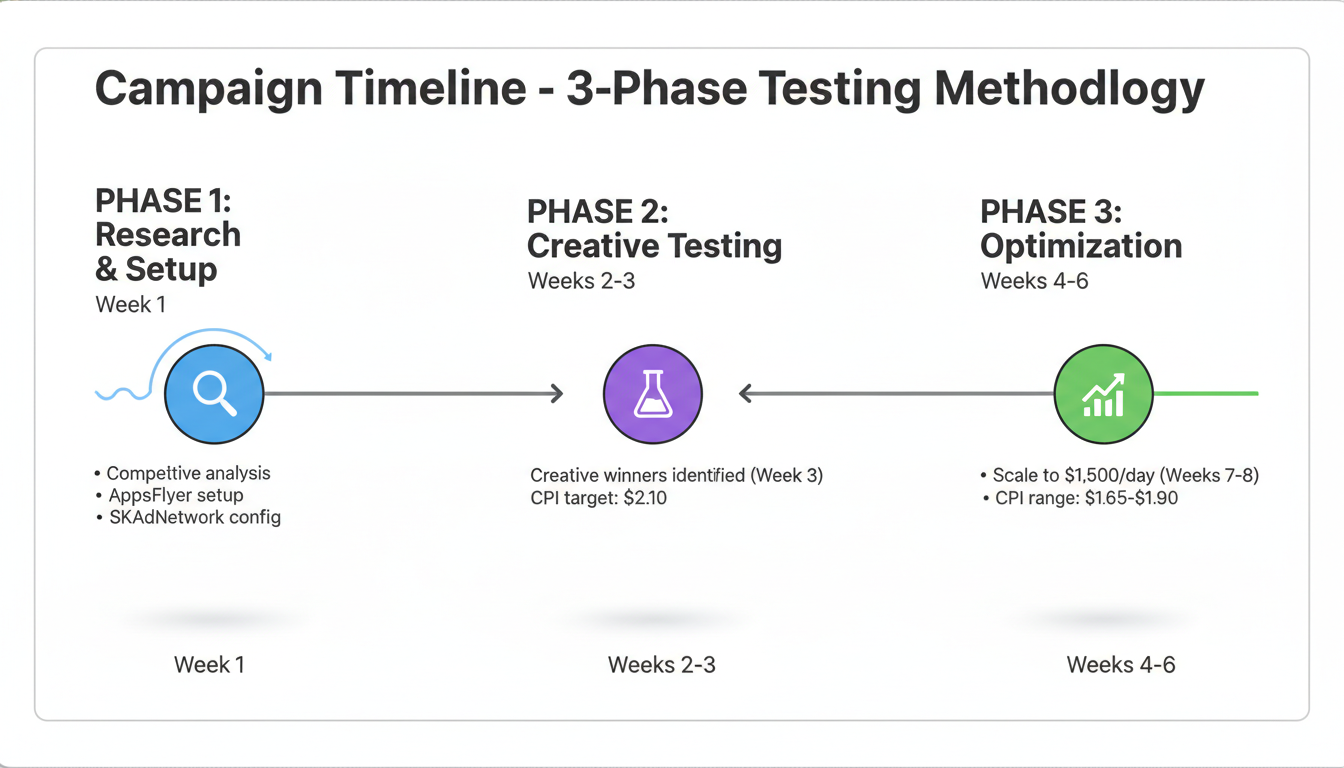
Week 1-2: CPI volatile during learning phase ($2.40-$3.80) Week 3: Creative winners identified, CPI stabilized at $2.10 Week 4-6: Optimization drove CPI to $1.65-$1.90 range Week 7-8: Scaled to $1,500/day while maintaining efficiency
According to advertising research, campaigns should achieve 50+ conversions before scaling—the team waited until Week 3 (200+ conversions) before increasing budget.
Repurposed Meta ads performed 2-3x worse than TikTok-native content. The team now develops platform-specific creative from the start rather than adapting existing assets.
Recommendation: Budget 40-50% of initial spend toward creative production and testing.
Counter to expectations, broad targeting (demographics only) delivered 22% lower CPI than interest-based targeting. TikTok's algorithm efficiently identified high-intent users when given quality creative signals.
TikTok users showed higher engagement and retention than Meta-acquired users:
This challenges assumptions that "cheaper installs = lower quality."
Top-performing ads showed declining efficiency after 10-14 days. The team established a 2-week creative refresh cadence with 3-5 new variations always in testing.
SKAdNetwork data lagged 24-72 hours behind real-time install counts. The team learned to make decisions based on modeled attribution while using SKAN as validation.
CPIs vary significantly by app category and geography. According to TikTok CPC benchmarks, mobile apps and gaming typically see $0.50-$1.80 CPI. Fitness apps like FitTrack Pro fall within this range. Competitive categories and premium markets (US, UK, CA) command higher CPIs. Focus on downstream metrics (retention, LTV) rather than CPI alone.
Plan for $10,000-$20,000 minimum to generate statistically significant data. This budget should sustain 3-4 weeks of testing with multiple creative variations. For guidance on starting your campaigns, review how to run TikTok ads. TikTok recommends 50+ conversions to exit the learning phase—at a $2.00 CPI, that requires approximately $100 minimum spend per ad group.
Expect 2-3 weeks for performance to stabilize. Week 1 involves learning phase volatility. Week 2-3 reveals creative winners. Week 4+ allows optimization and scaling. Don't make major decisions based on first-week data.
By submitting this form, you agree to our Privacy Policy and Terms & Conditions.


