February 19, 2026


Setting realistic CTR expectations for AI Overviews prevents both unfounded panic and misplaced optimism. The numbers differ significantly from traditional organic results—and vary based on whether you're cited in the AI Overview, appearing in organic results below it, or both. Understanding these benchmarks helps you evaluate performance accurately.
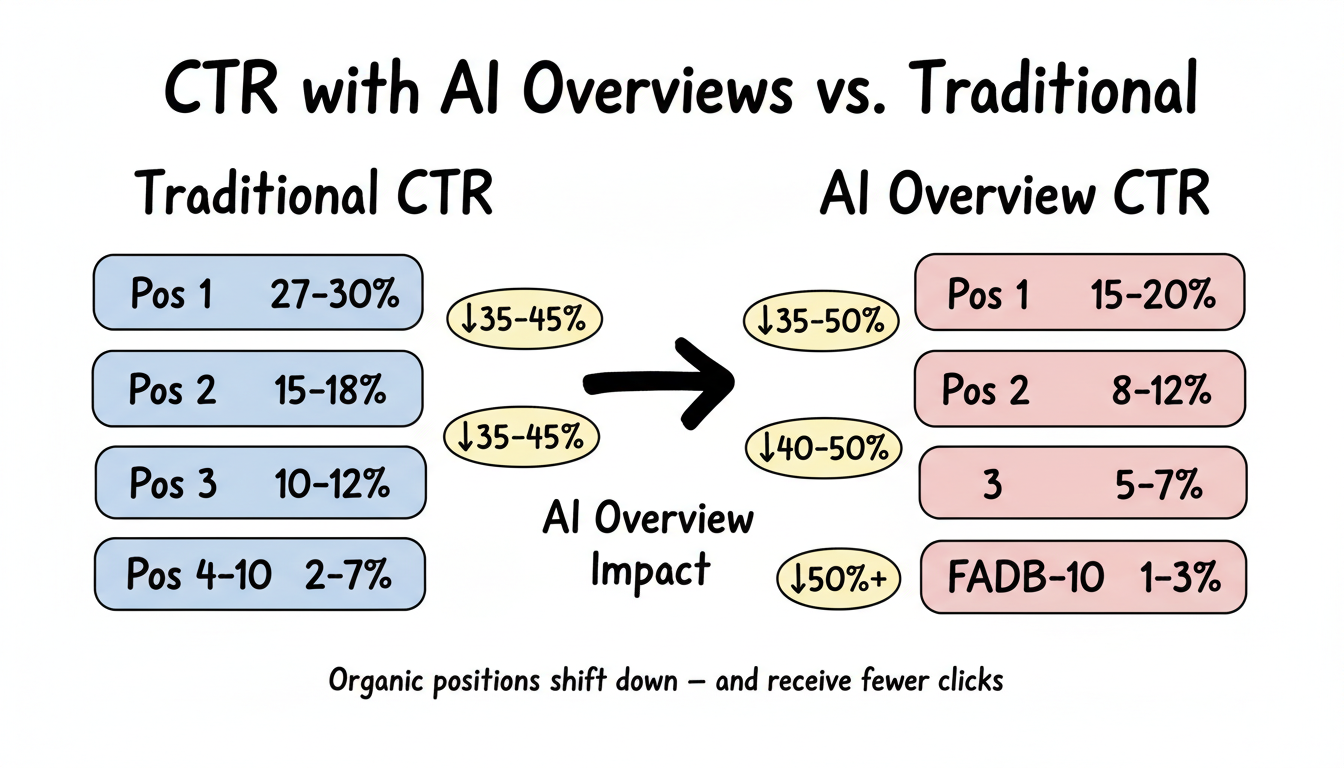
Traditional organic CTR benchmarks don't apply when AI Overviews appear.
Baseline shifts:
Position | Traditional CTR | CTR with AI Overview | Change |
Position 1 organic | 27-30% | 15-20% | -35% to -45% |
Position 2 organic | 15-18% | 8-12% | -35% to -45% |
Position 3 organic | 10-12% | 5-7% | -40% to -50% |
Positions 4-10 | 2-7% | 1-3% | -50% or more |
When AI Overviews appear, organic positions shift down the page and receive fewer clicks. But this tells only part of the story.

Your CTR depends heavily on whether your site appears within the AI Overview. Understanding multi-platform AEO strategy becomes critical for maintaining visibility across different AI-powered search experiences.
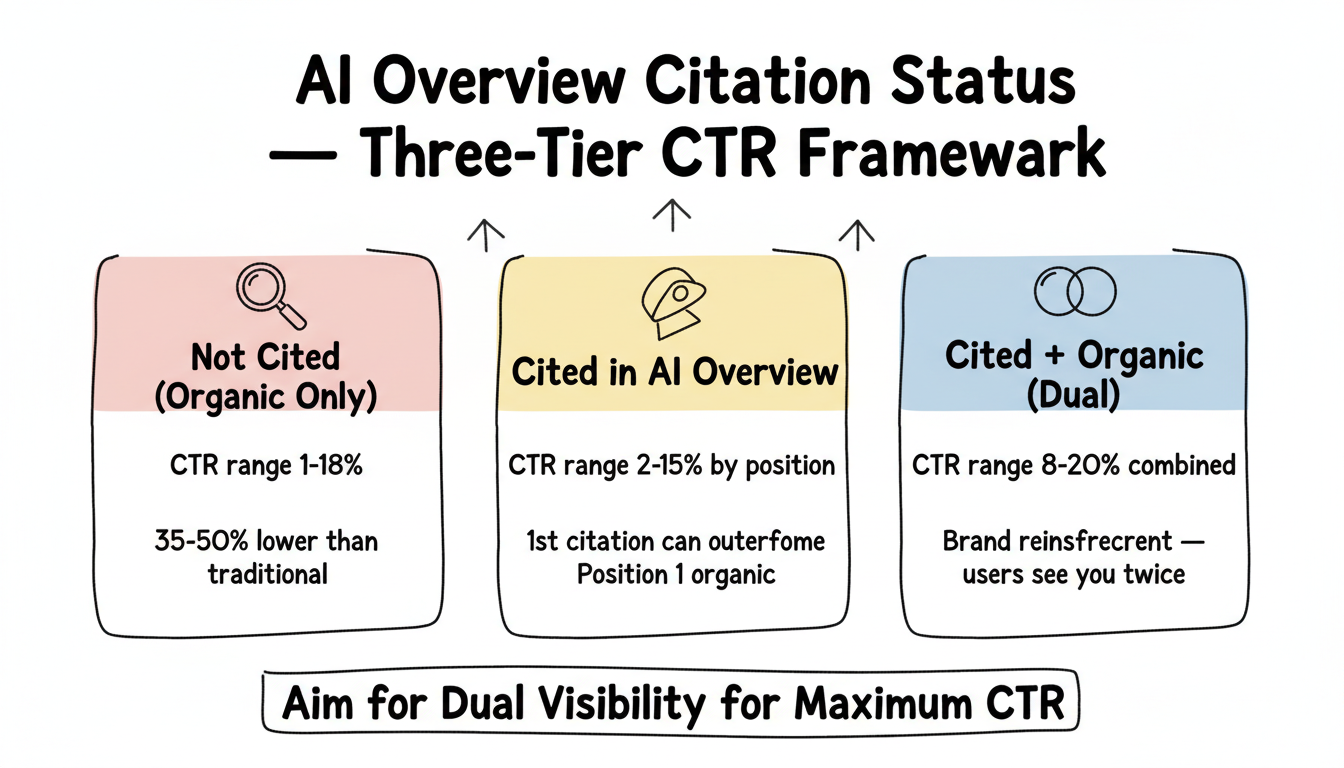
Being cited creates a different CTR dynamic than organic-only visibility.
Citation CTR expectations:
Citation Position | Expected CTR | Notes |
1st source cited | 8-15% | Highest AI citation visibility |
2nd source cited | 5-10% | Still significant traffic |
3rd-5th source | 2-6% | Diminishing but measurable |
Collapsed sources | 0.5-2% | Requires user expansion |
Key insight: First-position citations in AI Overviews can outperform traditional Position 1 organic results when that AI Overview also pushes organic results down the page.
When AI Overviews appear but your site isn't cited, expect compressed CTR. This is where implementing AI SEO best practices for 2026 can help you regain citation visibility.
Non-cited CTR expectations:
Your Organic Position | Expected CTR |
Position 1 (below AI Overview) | 10-18% |
Position 2 (below AI Overview) | 6-10% |
Position 3 (below AI Overview) | 3-6% |
Position 4+ (below AI Overview) | 1-3% |
These numbers represent 35-50% drops from traditional CTR benchmarks.
The best scenario: appearing in both the AI Overview and organic results.
Combined visibility CTR:
Total CTR Potential (estimated):

Citation in AI Overview: 5-12%
Organic position (reinforcement): +2-5%
Brand recognition lift: +1-3%
-----------------------------------
Combined potential: 8-20%
This dual presence creates brand reinforcement—users see your site twice, increasing click probability.
Different queries produce different CTR patterns.
Example: "What is answer engine optimization"
Visibility Type | Expected CTR | Why |
AI Overview citation | 3-8% | Users often get answer without clicking |
Organic below | 5-12% | Fewer clicks needed after AI answer |
Combined | 8-18% | Curiosity drives some exploration |
Informational queries see highest zero-click rates. Expect lower CTR but recognize that brand visibility occurs without clicks.
Example: "Best AEO tools for small business"
Visibility Type | Expected CTR | Why |
AI Overview citation | 8-15% | Users want more detail before decisions |
Organic below | 8-15% | Commercial intent drives clicks |
Combined | 15-25% | High intent increases all click rates |
Commercial queries maintain higher CTR because users need more information than AI summaries provide.
Example: "AEO vs traditional SEO"
Visibility Type | Expected CTR | Why |
AI Overview citation | 6-12% | Some comparisons answered directly |
Organic below | 6-12% | Users often want detailed breakdown |
Combined | 12-22% | Comparison seekers explore multiple sources |
Comparison queries fall between informational and commercial CTR patterns.
Example: "Buy AEO audit service"
AI Overviews appear less frequently for transactional queries. When they do:
Visibility Type | Expected CTR | Why |
AI Overview citation | 10-20% | High purchase intent |
Organic below | 12-20% | Direct action desired |
Combined | 18-30% | Buyers click to transact |
Transactional queries maintain relatively strong CTR because users need to reach a site to complete actions.
CTR varies by industry based on query complexity and user behavior.
Industry CTR benchmarks (AI Overview present):
Industry | Citation CTR | Organic CTR | Notes |
B2B SaaS | 6-12% | 8-14% | Complex decisions drive clicks |
E-commerce | 4-10% | 6-12% | Product pages need visits |
Professional services | 8-15% | 10-16% | High-value decisions |
Healthcare information | 5-10% | 8-14% | Users verify with multiple sources |
Financial services | 6-12% | 8-15% | Sensitive topics need depth |
General content | 3-8% | 5-10% | Varies widely by topic |
B2B and professional services see higher CTR because purchase decisions require more research than AI summaries provide.
Use these frameworks to establish achievable CTR goals. Many businesses partner with AEO consulting services to develop data-driven CTR improvement strategies.
Target progression:
Phase 1: Get cited in AI Overviews
- Target: Appear in any source position
- Expected CTR: 2-5%
- Timeline: 2-4 months optimization

Phase 2: Improve citation position
- Target: Top 3 cited sources
- Expected CTR: 5-10%
- Timeline: 3-6 months

Phase 3: Achieve dual visibility
- Target: Citation + Page 1 organic
- Expected CTR: 10-18%
- Timeline: 6-12 months
Optimization targets:
Current State | Target | Expected CTR Gain |
Positions 4-6 cited | Top 3 position | +3-5% CTR |
Position 2-3 cited | Position 1 | +3-8% CTR |
Position 1 cited | Maintain + organic | +2-5% CTR |
Track these metrics to understand your AI Overview CTR performance. Consider leveraging Google Analytics 4 AI search tracking to gain deeper insights into how users interact with your content after clicking from AI-powered results.
What you can measure:
Metric | How to Track | Limitations |
Organic CTR | Google Search Console | Doesn't separate AI-affected queries |
AI referral traffic | GA4 channel grouping | Indirect measurement |
Query-level performance | GSC by query | AI Overview presence not indicated |
Click trends over time | GSC date comparisons | External factors affect data |
What you can't directly measure:
Work with available data while acknowledging measurement gaps.
Not all CTR declines require action.
Acceptable CTR drops:
Situation | Why It's Acceptable |
AI Overview appears, CTR drops 30% | Expected behavior |
Citation gained, CTR stable | Brand visibility increased |
Informational queries see low CTR | Zero-click searches are normal |
CTR drops requiring action:
Situation | Recommended Response |
Lost citation, CTR dropped 50%+ | Audit and re-optimize content |
Competitors gaining citations | Analyze their approach |
CTR declining month-over-month | Investigate content freshness |
Setting realistic AI Overview CTR expectations:
AI Overview CTR differs fundamentally from traditional organic CTR. Calibrate expectations accordingly, optimize for citations, and measure what you can while accepting measurement limitations.
By submitting this form, you agree to our Privacy Policy and Terms & Conditions.


