February 19, 2026


Google AI Overviews now appear in approximately 13% of all searches, and their impact on organic traffic varies dramatically across industries. Some sectors face 79% traffic declines while others experience relatively modest losses. Understanding these industry-specific patterns helps businesses prepare realistic expectations and allocate resources appropriately.
This data-driven analysis breaks down AI Overview impact by industry, revealing which sectors face the greatest disruption and why.
Before examining industry specifics, the aggregate data establishes the baseline challenge. Research from multiple studies in 2025 documents consistent patterns across millions of queries.
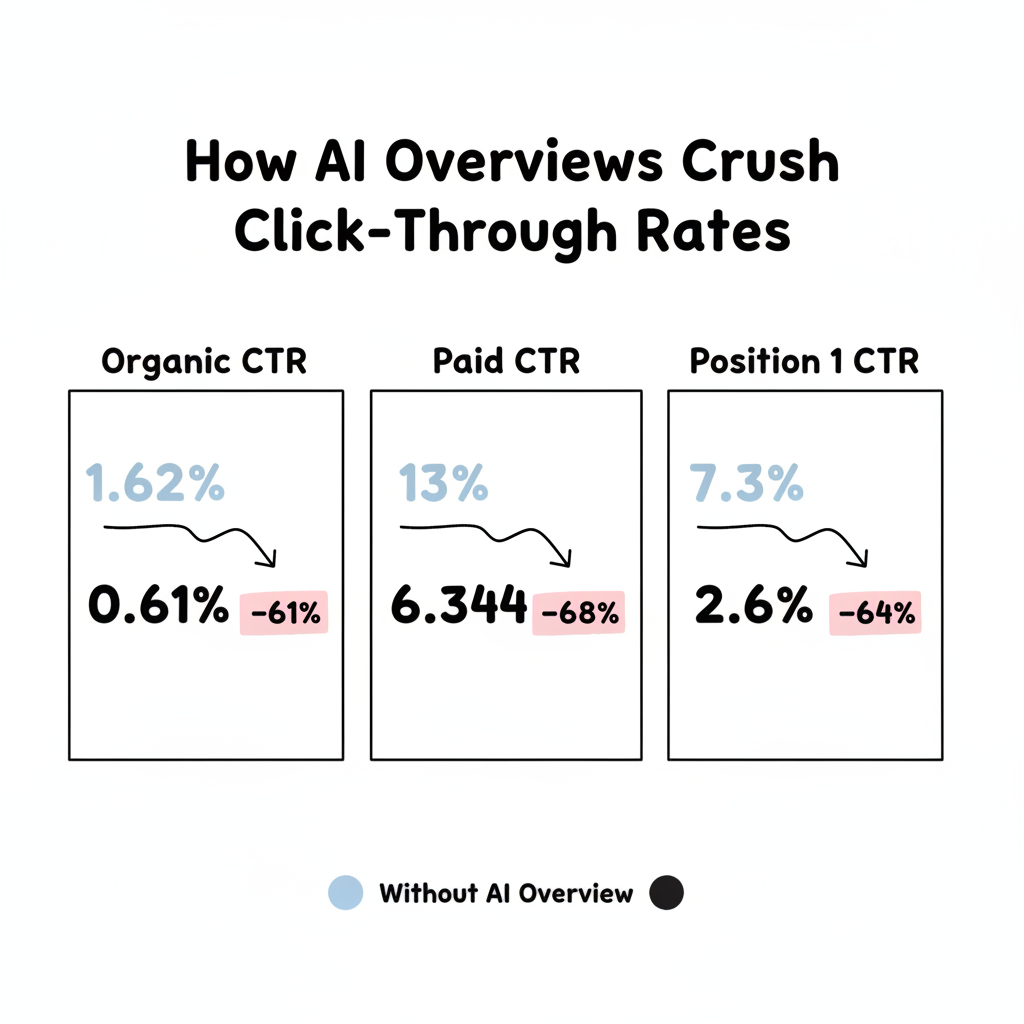
The numbers paint a stark picture:
Metric | Without AI Overview | With AI Overview | Decline |
Organic CTR | 1.62% | 0.61% | -61% |
Paid CTR | 13% | 6.34% | -68% |
Position 1 CTR | 7.3% | 2.6% | -64% |
These aren't marginal shifts—AI Overviews reduce click-through rates by more than half across virtually all query types. The first organic result, which historically earned the lion's share of clicks, now captures barely a quarter of its previous traffic when an AI Overview appears.
Even when your content gets cited in an AI Overview, the traffic impact remains significant:
Being cited is better than being ignored, but it's not the traffic recovery solution many hoped for.
Science-related queries show the highest AI Overview saturation at approximately 26% of searches. The sector faces unique challenges:
Why science is vulnerable:
Science publishers, educational institutions, and research organizations face the greatest AI Overview disruption. Content that answers "what is" and "how does" questions gets summarized comprehensively, eliminating the need for click-throughs.
The food and drink industry experienced the fastest AI Overview growth—a 7.25 percentage point increase since early 2025. Recipe sites and food bloggers built entire business models around organic search traffic that's now evaporating.
Impact factors:
Food bloggers report traffic declines of 40-60% on recipe content. The industry's reliance on advertising revenue makes these losses particularly devastating.
Healthcare websites face approximately 16% AI Overview saturation. While E-E-A-T requirements provide some protection, the sector isn't immune:
Healthcare-specific dynamics:
Healthcare content that answers informational queries faces significant impact. However, content requiring professional trust signals—treatment recommendations, medical advice, provider evaluations—retains more traffic as users seek authoritative sources.
Technology content experiences roughly 18% AI Overview coverage, with the sector showing continued growth. Technical documentation, how-to guides, and product comparisons all face substantial AI summarization.
Tech sector vulnerabilities:
Technology publishers and software documentation sites report significant traffic declines, particularly for informational and tutorial content.
Real estate shows only 2.14% AI Overview saturation—among the lowest of any sector. However, the industry experienced the fastest growth rate at 258% increase in early 2025.
Why real estate is protected:
Real estate professionals should monitor AI Overview expansion but currently face less disruption than information-heavy sectors.
Shopping queries trigger AI Overviews in roughly 2.7% of searches, though the impact varies by query type:
Ecommerce impact patterns:
Ecommerce sites with strong brand recognition maintain direct navigation traffic, while sites dependent on informational queries face greater pressure.
Local businesses—lawyers, plumbers, contractors—experience relatively less AI Overview disruption for service queries:
Local service advantages:
However, informational content from local service providers faces the same challenges as other industries.
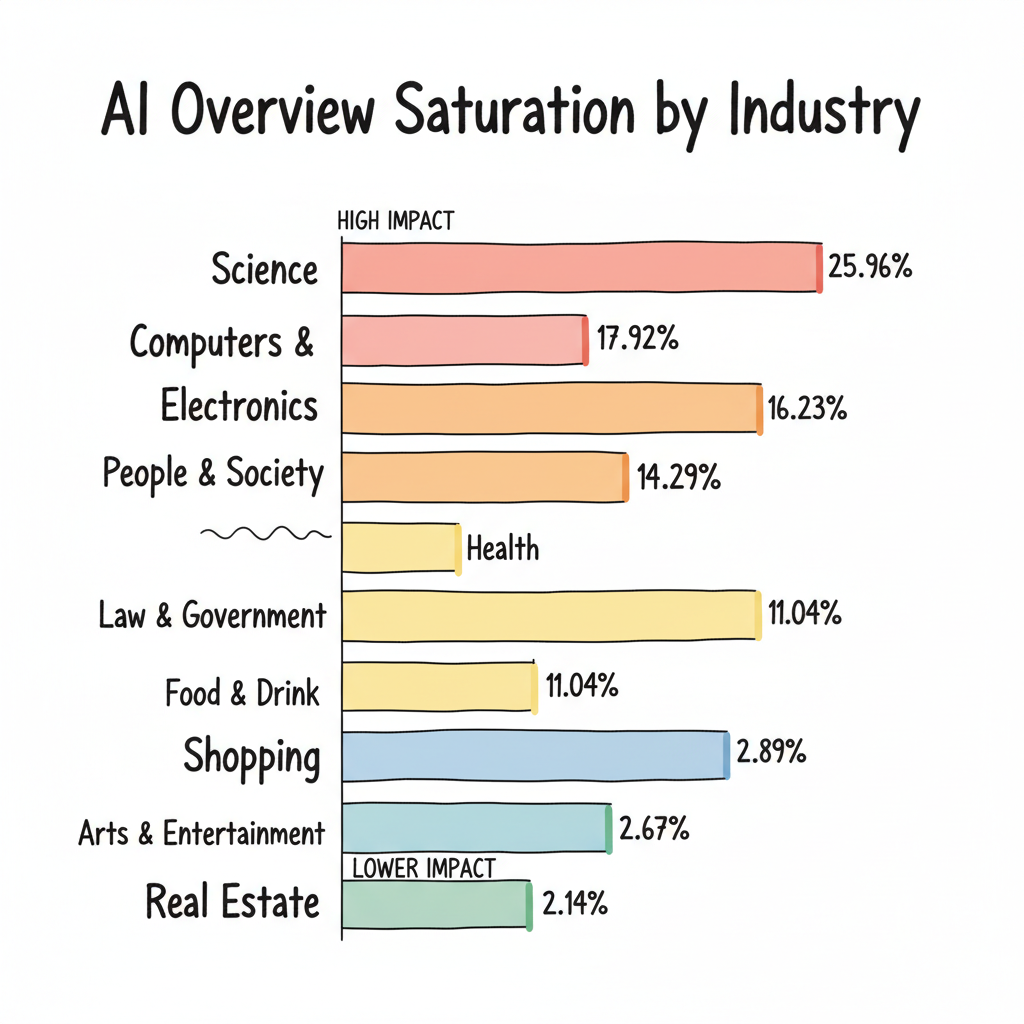
Research analyzing 11,000 domains across 20+ industries reveals the current landscape:
Industry | AI Overview % | Trend |
Science | 25.96% | Stable |
Computers & Electronics | 17.92% | Growing |
People & Society | 17.29% | Declining |
Health | 16.23% | Declining |
Law & Government | 14.87% | Growing |
Food & Drink | 11.04% | Rapidly Growing |
Arts & Entertainment | 2.89% | Stable |
Shopping | 2.67% | Growing |
Real Estate | 2.14% | Growing |
The pattern reveals Google's strategic approach: high-trust, information-dense categories where users seek authoritative answers receive priority AI treatment.
Understanding the difference between GEO and SEO becomes critical as traditional optimization tactics prove less effective in AI-mediated search environments.
Many businesses considering their AI search platform selection framework need to evaluate which platforms best serve their industry's specific search patterns.
Generic industry statistics provide context, but your specific situation requires measurement:
Track these metrics:
Compare your data against industry benchmarks to understand whether you're performing above or below sector averages. Avoiding common AEO marketing mistakes requires continuous measurement and adaptation as AI Overview patterns evolve.
AI Overview impact continues evolving. Industries currently experiencing low saturation may face rapid expansion, as real estate's 258% growth demonstrates. Industries with high saturation may see stabilization as AI Overview effectiveness reaches natural limits.
The consistent finding across all research: relying solely on traditional organic search traffic creates business risk regardless of industry. Diversification—across traffic sources, content formats, and business models—provides the resilience that industry-specific optimization alone cannot deliver.
Understanding your industry's AI Overview exposure helps prioritize response strategies. But the underlying trend—AI-mediated search reducing website traffic—affects every sector eventually. Those exploring GEO optimization tactics can adapt proven strategies to their industry's specific challenges. The question isn't whether AI Overviews will impact your industry, but how quickly and severely.
By submitting this form, you agree to our Privacy Policy and Terms & Conditions.


