February 19, 2026


LinkedIn advertising costs more than most digital platforms, but for B2B marketers, the premium often delivers results that justify the investment. Understanding what you'll actually pay—and how to optimize that spend—makes the difference between profitable campaigns and budget waste.
This guide breaks down 2026 LinkedIn ad costs by metric, industry, and campaign type, plus provides a practical framework for calculating your expected spend.
LinkedIn advertising operates on an auction model where you compete with other advertisers targeting similar audiences. Your actual costs depend on several factors: targeting specificity, competition in your industry, ad format, and campaign objective.
Here's what you can expect to pay in 2026:
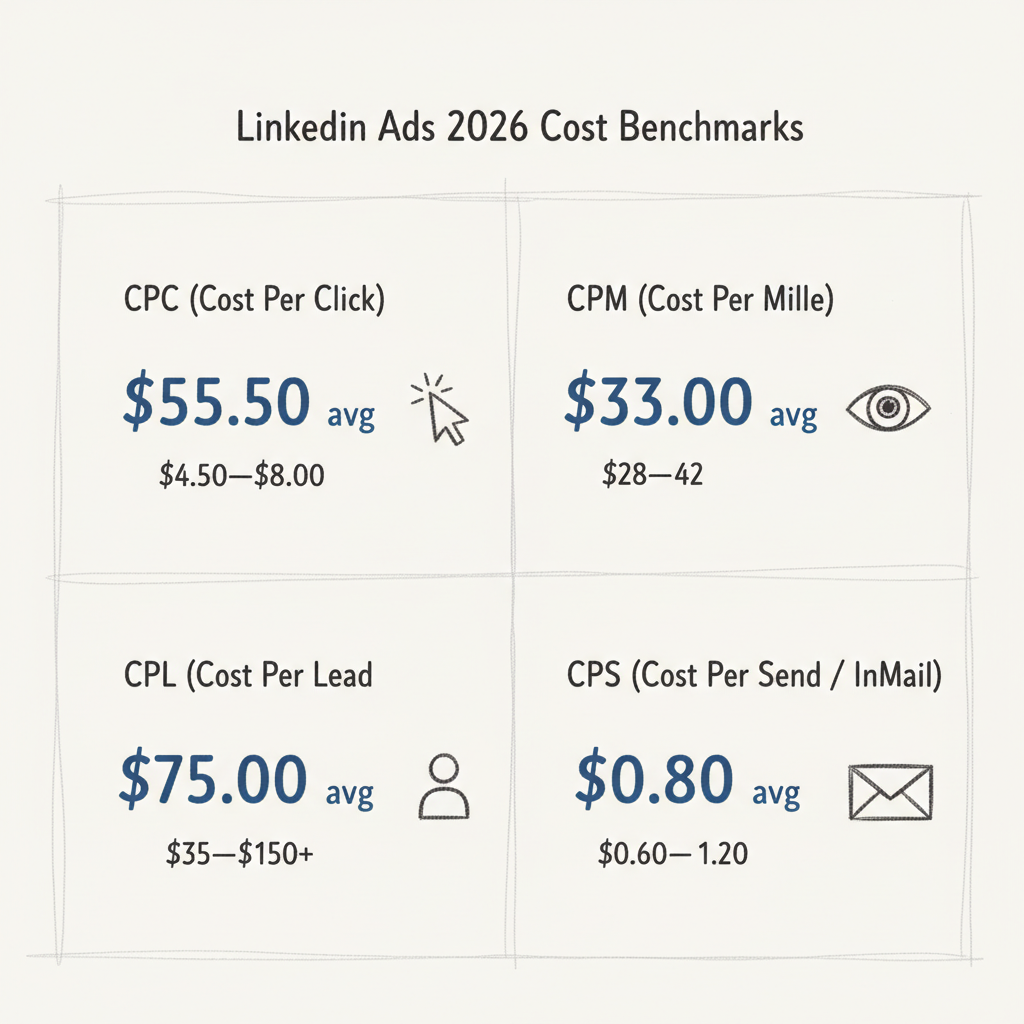
Metric | 2026 Average | Range |
Cost Per Click (CPC) | $5.50 | $4.50 - $8.00 |
Cost Per Mille (CPM) | $33.00 | $28.00 - $42.00 |
Cost Per Lead (CPL) | $75.00 | $35.00 - $150.00+ |
Cost Per Send (InMail) | $0.80 | $0.60 - $1.20 |
According to industry data, LinkedIn CPMs increased approximately 28% year-over-year in recent periods, a trend that continues into 2026 as more B2B advertisers compete for professional audiences. When evaluating LinkedIn sponsored content cost, these benchmark ranges provide a starting point for budget planning.
CPC varies significantly based on your target audience and industry. More competitive B2B sectors with high customer lifetime values see higher click costs.
Industry | Average CPC | Notes |
Technology/SaaS | $6.50 - $9.00 | Highest competition for tech buyers |
Financial Services | $6.00 - $8.50 | Heavily targeted decision-makers |
Healthcare/Pharma | $5.50 - $7.50 | Growing B2B healthcare marketing |
Professional Services | $5.00 - $7.00 | Consulting, legal, accounting |
Manufacturing | $4.50 - $6.50 | Lower competition, specific audiences |
Education/EdTech | $4.00 - $6.00 | Varies by B2B vs B2C targeting |
Recent benchmarks show that across all industries, the average LinkedIn CPC hovers around $5.50, though B2B-heavy verticals consistently pay more due to the value of reaching professional decision-makers. Understanding LinkedIn ads cost per lead metrics helps contextualize these CPC figures within your broader campaign economics.
CPM—cost per 1,000 impressions—matters most for brand awareness campaigns where reach is the primary goal.
Campaign Type | Average CPM |
Sponsored Content (Single Image) | $30 - $38 |
Sponsored Content (Video) | $35 - $45 |
Sponsored Content (Carousel) | $28 - $36 |
Document Ads | $25 - $32 |
Text Ads | $10 - $15 |
Dynamic Ads | $32 - $42 |
The global average LinkedIn CPM sits around $28-$33 in 2026, though this varies substantially by region, audience targeting, and time of year. For detailed campaign setup guidance, see our complete guide to LinkedIn advertising.
Region | Average CPM |
North America | $35 - $45 |
Western Europe | $30 - $40 |
Australia/NZ | $28 - $38 |
Asia Pacific | $18 - $28 |
Latin America | $12 - $22 |
North American advertisers pay premium rates due to higher competition for English-speaking professionals in major markets.
For most B2B marketers, cost per lead is the metric that matters most. LinkedIn's Lead Gen Forms typically deliver better CPL than landing page conversions because they reduce friction. Many agencies specializing in LinkedIn B2B marketing focus exclusively on optimizing these lead generation metrics.
Ad Format | Average CPL | Lead Form Completion Rate |
Document Ads with Lead Gen | $45 - $65 | 22.7% |
Single Image with Lead Gen | $65 - $95 | 12.4% |
Video Ads with Lead Gen | $85 - $120 | 8.5% |
Carousel with Lead Gen | $55 - $80 | 15.2% |
Message Ads (InMail) | $70 - $110 | Varies by offer |
According to campaign analysis data, Document Ads consistently deliver the lowest CPL due to higher engagement rates—users who click to download content are often more qualified leads than general clickers.
Industry | Average CPL | Range |
Technology/SaaS | $85 - $150 | Higher due to competition |
Financial Services | $75 - $130 | Compliance adds complexity |
Professional Services | $55 - $90 | Strong performance typically |
Healthcare B2B | $65 - $110 | Niche but engaged audiences |
Manufacturing | $45 - $80 | Lower competition |
HR/Recruiting | $40 - $70 | Natural LinkedIn audience fit |
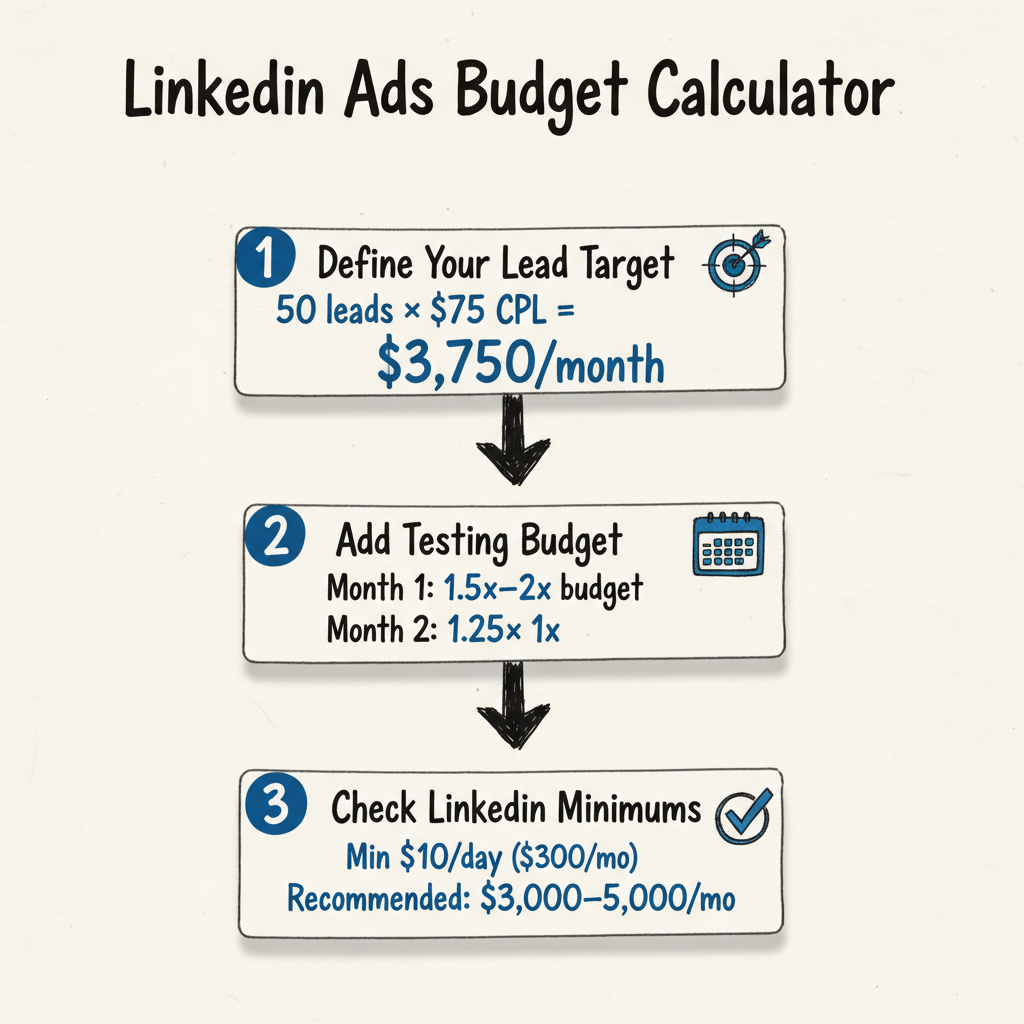
Use this framework to estimate your monthly LinkedIn advertising budget based on your goals.
Start with how many leads you need monthly and work backward:
Example Calculation:
New campaigns need testing budget for the first 2-3 months:
| Campaign Maturity | Testing Budget Multiplier | | --- | --- | --- | | Month 1 (New Campaign) | 1.5x - 2x base budget | | Month 2 (Optimizing) | 1.25x base budget | | Month 3+ (Optimized) | 1x base budget |
LinkedIn requires minimum daily budgets:
Understanding these minimums is crucial whether you're working with LinkedIn marketing partners or running campaigns in-house.
Monthly Budget | Expected Clicks (at $5.50 CPC) | Expected Leads (at $75 CPL) |
$1,000 | ~180 clicks | ~13 leads |
$3,000 | ~545 clicks | ~40 leads |
$5,000 | ~909 clicks | ~67 leads |
$10,000 | ~1,818 clicks | ~133 leads |
$25,000 | ~4,545 clicks | ~333 leads |
LinkedIn prices campaigns differently based on your selected objective. Understanding these differences helps optimize spend, especially when learning how to run LinkedIn ads effectively.
Brand Awareness:
Website Visits:
Engagement:
Video Views:
Lead Generation:
Understanding LinkedIn lead generation campaign structures helps optimize these conversion-focused objectives.
Website Conversions:
Job Applicants:
Several variables impact what you'll actually pay:
Narrower targeting typically costs more per result but often delivers better qualified leads. Mastering LinkedIn advertising targeting options can significantly impact your cost efficiency.
Audience Size | Impact on Costs |
500K+ members | Lower CPCs, less precise targeting |
100K-500K | Balanced cost and targeting |
20K-100K | Higher CPCs, more relevant audience |
Under 20K | Highest CPCs, may limit delivery |
Strategy | Best For | Cost Impact |
Maximum Delivery | Spending full budget quickly | Often pays premium CPCs |
Manual Bidding | Cost control, experienced advertisers | Can reduce costs 10-30% |
Target Cost | Predictable CPL campaigns | Moderate optimization |
Implementing an effective LinkedIn ads bidding strategy requires testing these approaches against your specific campaign objectives.
LinkedIn's algorithm considers ad relevance when determining auction winners. Higher relevance scores can reduce costs by 20-40% compared to low-relevance ads.
Improving relevance:
LinkedIn advertising costs fluctuate throughout the year:
Period | Cost Impact |
Q1 (Jan-Mar) | Moderate - post-holiday budget reset |
Q2 (Apr-Jun) | Higher - fiscal year planning budgets |
Q3 (Jul-Aug) | Lower - summer slowdown |
Q4 (Sep-Dec) | Highest - end-of-year budget pushes |
Lead Gen Forms consistently deliver better CPL than website conversion campaigns. Platform data shows that Lead Gen Forms convert at 3-5x the rate of landing pages due to pre-filled professional data. Review our LinkedIn lead generation strategies for comprehensive optimization tactics.
Document Ads (carousel-style content downloads) deliver CPLs 20-25% lower than single image ads in most B2B campaigns. The interactive format drives higher engagement and better lead quality.
Combine targeting layers for precision without over-restriction:
LinkedIn retargeting audiences (website visitors, video viewers, Lead Gen Form openers) typically convert at 2-3x the rate of cold audiences, dramatically reducing effective CPL.
Improve ad relevance through:
Leveraging LinkedIn advertising templates can accelerate your testing cycles while maintaining consistency.
LinkedIn requires a minimum of $10/day per campaign ($300/month). However, most advertisers need $3,000-$5,000 monthly to generate statistically meaningful data for optimization. Budgets under $1,000/month often struggle to exit the learning phase. For emerging companies, our guide on LinkedIn ads for startups addresses budget-constrained approaches.
LinkedIn's professional audience commands premium pricing because users provide verified professional data (job titles, companies, industries) that enables precise B2B targeting impossible on other platforms. You're paying for access to decision-makers at specific companies, not just demographic proxies. See our Facebook ads cost comparison for detailed platform benchmarking.
Focus on improving ad relevance scores, testing Document Ads, using Lead Gen Forms instead of landing pages, implementing retargeting, and bidding manually rather than using maximum delivery. Most advertisers can reduce CPL by 20-40% through these optimizations. Working with the best LinkedIn ad agency can accelerate this optimization process.
"Good" CPL depends entirely on your customer lifetime value. For most B2B SaaS companies, CPL under $100 is considered efficient. Professional services often see $50-$80 CPL. Enterprise software with high contract values can justify CPL over $200 if lead quality supports it.
LinkedIn advertising represents a significant investment for B2B marketers, but understanding the cost structure and optimization opportunities makes it possible to generate predictable, scalable pipeline. Whether you're exploring LinkedIn advertising support resources or studying LinkedIn advertising case studies from similar industries, the key is matching your spend to measurable business outcomes rather than focusing solely on cost metrics.
By submitting this form, you agree to our Privacy Policy and Terms & Conditions.


