February 19, 2026


Spending money on Facebook ads without measuring returns is like flying blind. Calculating ROI on Facebook ads tells you whether your campaigns are profitable and helps you decide where to invest more—or cut your losses.
This guide covers the essential formulas, tracking requirements, real calculation examples, and 2026 benchmarks to evaluate your performance.
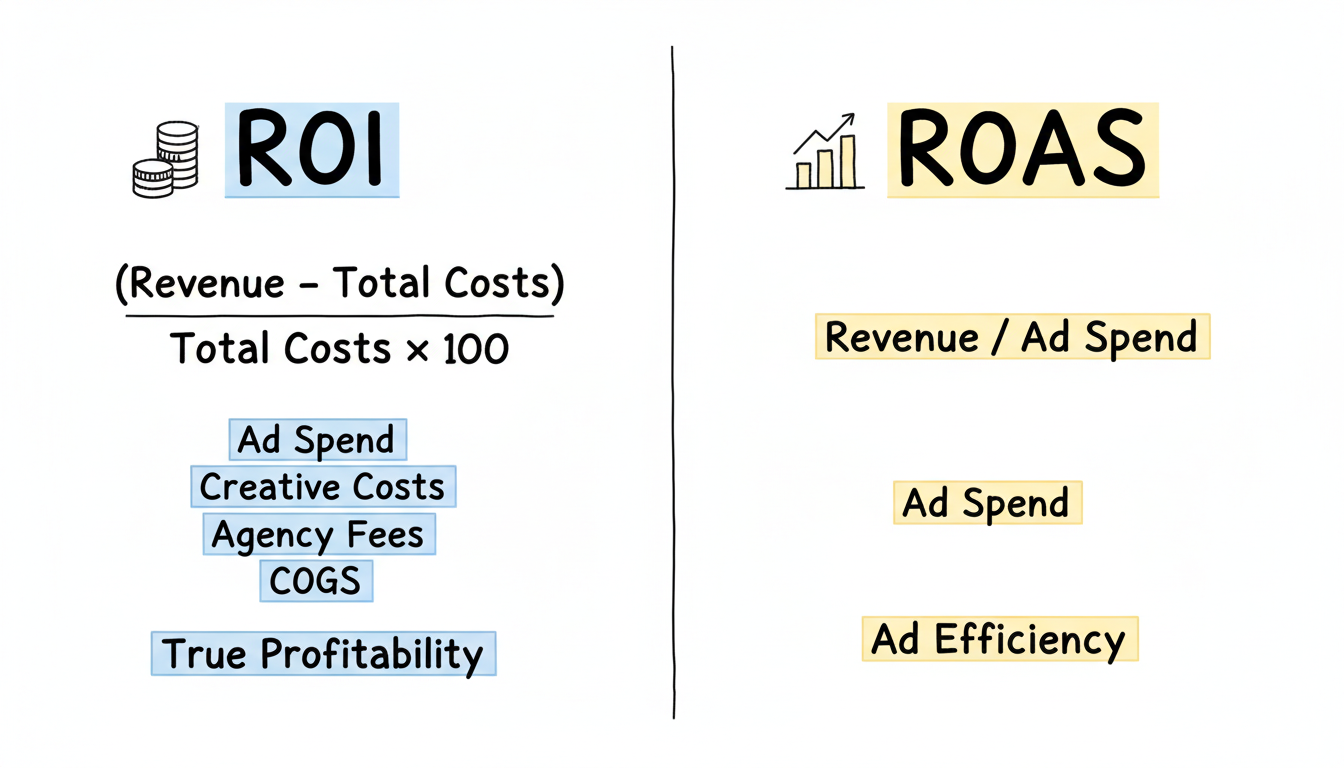
There are two key metrics for measuring Facebook ad returns: ROI and ROAS. Understanding the difference helps you choose the right one for your analysis.
ROI measures your overall profit relative to total investment, including all costs beyond just ad spend.
ROI = (Revenue - Total Costs) / Total Costs × 100When analyzing Facebook ads cost per month, total costs should include your Facebook Ads budget, creative production costs (graphics, video, copywriting), and any management or agency fees.
Example:
ROI = ($10,000 - $3,000) / $3,000 × 100 = 233%A 233% ROI means you made $2.33 profit for every $1 invested.
ROAS focuses specifically on revenue generated compared to ad spend only, excluding other costs.
ROAS = Revenue from Ads / Ad SpendAs explained by ROAS calculation guides, "Revenue from ads is the total income generated by your ads—everything earned from clicks that convert to sales."
Example:
ROAS = $20,000 / $5,000 = 4.0A ROAS of 4.0 means you earn $4 for every $1 spent on ads. This is often expressed as "4x ROAS" or "400% ROAS."
Metric | Best For | Includes |
ROI | Overall profitability | All costs (ads, creative, fees, COGS) |
ROAS | Ad performance specifically | Ad spend only |
Use ROAS to evaluate campaign efficiency. Use ROI to understand true business profitability after all costs.
Accurate ROI calculation requires proper tracking. Without it, you're working with incomplete data.
Meta Pixel – Install on your website to track conversions, add-to-carts, and other events.
Conversions API (CAPI) – Server-side tracking that captures conversions the Pixel might miss due to browser restrictions.
UTM Parameters – Add to ad URLs for tracking in Google Analytics and other tools.
Conversion Events – Set up events for key actions: purchases, leads, signups.
According to Facebook advertising metrics guides, "If you're running an ecommerce campaign and tracking purchases using the Meta Pixel and/or Conversions API, Facebook calculates ROAS automatically."
Modern tracking has limitations. Event marketing analysis notes that "With incomplete tracking, the ROAS you see in Ads Manager is likely under-reported. If Facebook says 2×, it might actually be 3× when accounting for modeled conversions."
To get a complete picture:
Let's walk through real-world scenarios to help you understand how to run Facebook ads for business profitably.
An online store runs Facebook ads for one month:
Metric | Value |
Ad spend | $5,000 |
Purchases tracked | 200 |
Revenue from purchases | $12,000 |
Average order value | $60 |
ROAS Calculation:
ROAS = $12,000 / $5,000 = 2.4Cost Per Purchase:
CPA = $5,000 / 200 = $25 per purchaseIf profit margin is 40% ($24 per order), this campaign is marginally profitable.
A B2B company runs lead gen ads:
Metric | Value |
Ad spend | $3,000 |
Leads generated | 150 |
Leads that became customers | 15 |
Average customer value | $1,500 |
Revenue from new customers | $22,500 |
ROAS Calculation:
ROAS = $22,500 / $3,000 = 7.5Cost Per Lead:
CPL = $3,000 / 150 = $20 per leadCost Per Customer:
CPA = $3,000 / 15 = $200 per customerWith $1,500 customer value and $200 acquisition cost, this campaign is highly profitable.
To find your break-even ROAS:
Break-even ROAS = 1 / Profit MarginProfit Margin | Break-even ROAS |
20% | 5.0 |
30% | 3.33 |
40% | 2.5 |
50% | 2.0 |
60% | 1.67 |
If your profit margin is 40%, you need at least 2.5x ROAS just to break even before accounting for other costs. Use a Facebook ads cost calculator to estimate your required budget based on these margins.
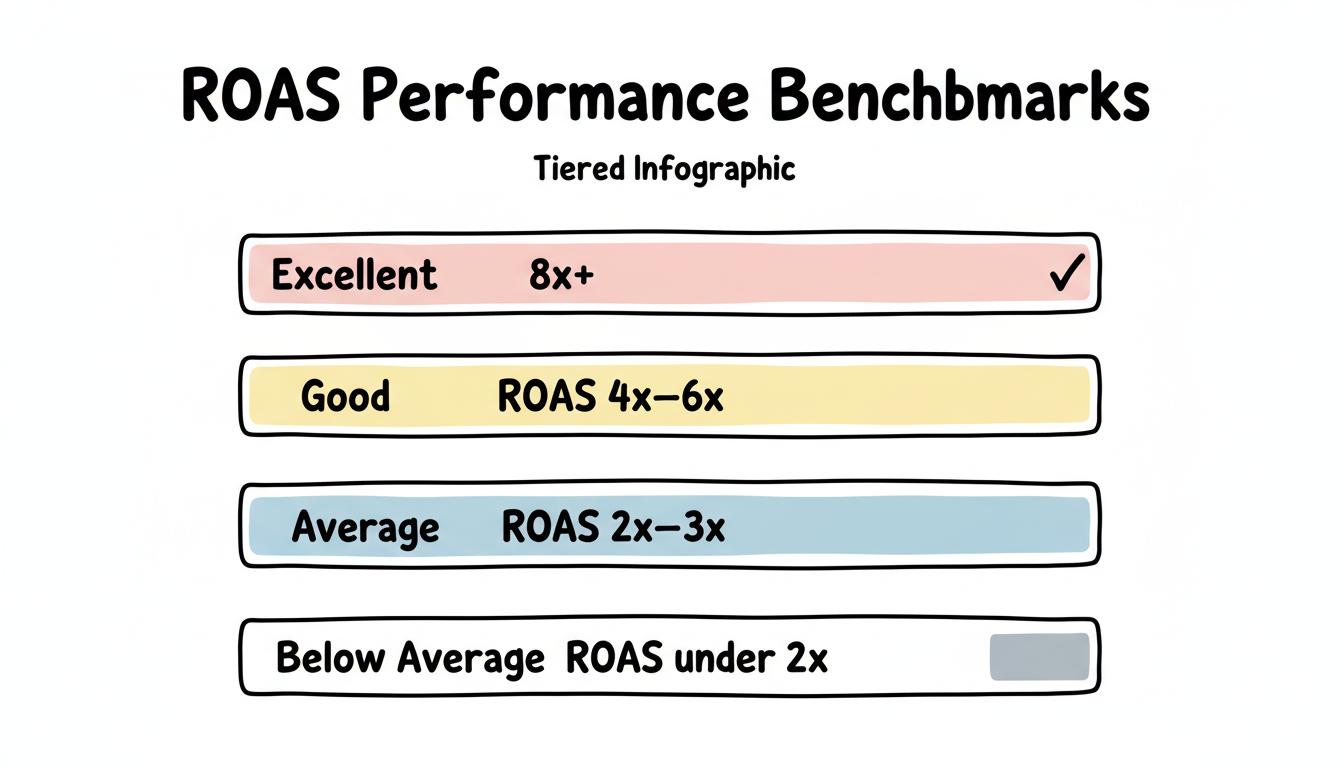
How do your results compare? Here are 2026 industry benchmarks.
According to Facebook ROI research, "For most industries, a 4x–6x ROAS is healthy, while high-ticket e-commerce or B2B brands may reach 8x–10x with strong optimization."
Industry data shows "the median ROAS on Facebook Ads is 2.24" across all advertisers, though top performers significantly exceed this. Understanding average ROI Facebook ads helps set realistic expectations.
Performance Level | ROAS |
Below average | Under 2x |
Average | 2x - 3x |
Good | 4x - 6x |
Excellent | 8x+ |
Facebook statistics for 2026 report "the average conversion rate for Facebook ads is approximately 9.21%," with significant variation by industry:
Industry | Conversion Rate |
Fitness | 14.29% |
Education | 13.58% |
Healthcare | 11.00% |
Average (all industries) | 9.21% |
Technology | 2.31% |
Current benchmarks show CTR ranging from "1.8% to 2.53% across industries"—up from historical averages due to AI-driven targeting improvements.
A positive ROI means profit—any number above 0% is technically "good." However, most advertisers target at least 100-200% ROI (doubling or tripling their investment) to justify the time and effort. For ROAS specifically, aim for at least 3x-4x to ensure profitability after all costs.
Attribution windows, cross-device tracking gaps, and privacy restrictions cause discrepancies. Ads Manager may undercount conversions (especially with iOS users). Compare platform data against your actual sales data and use server-side tracking to improve accuracy.
By submitting this form, you agree to our Privacy Policy and Terms & Conditions.


