February 19, 2026


Planning a Facebook advertising campaign without understanding your costs is like driving without a fuel gauge. A Facebook ads cost calculator helps you estimate your budget, project results, and avoid overspending on campaigns that don't deliver.
In this guide, we'll walk you through the essential formulas to calculate your Facebook ad costs, explain the key metrics that determine your spend, and show you how to project your budget based on your goals.
Facebook advertising costs depend on several interconnected metrics. Understanding these formulas helps you forecast your budget and measure campaign performance accurately, whether you're running Facebook ads for clients or managing your own campaigns.
Here are the essential calculations every advertiser needs to know:
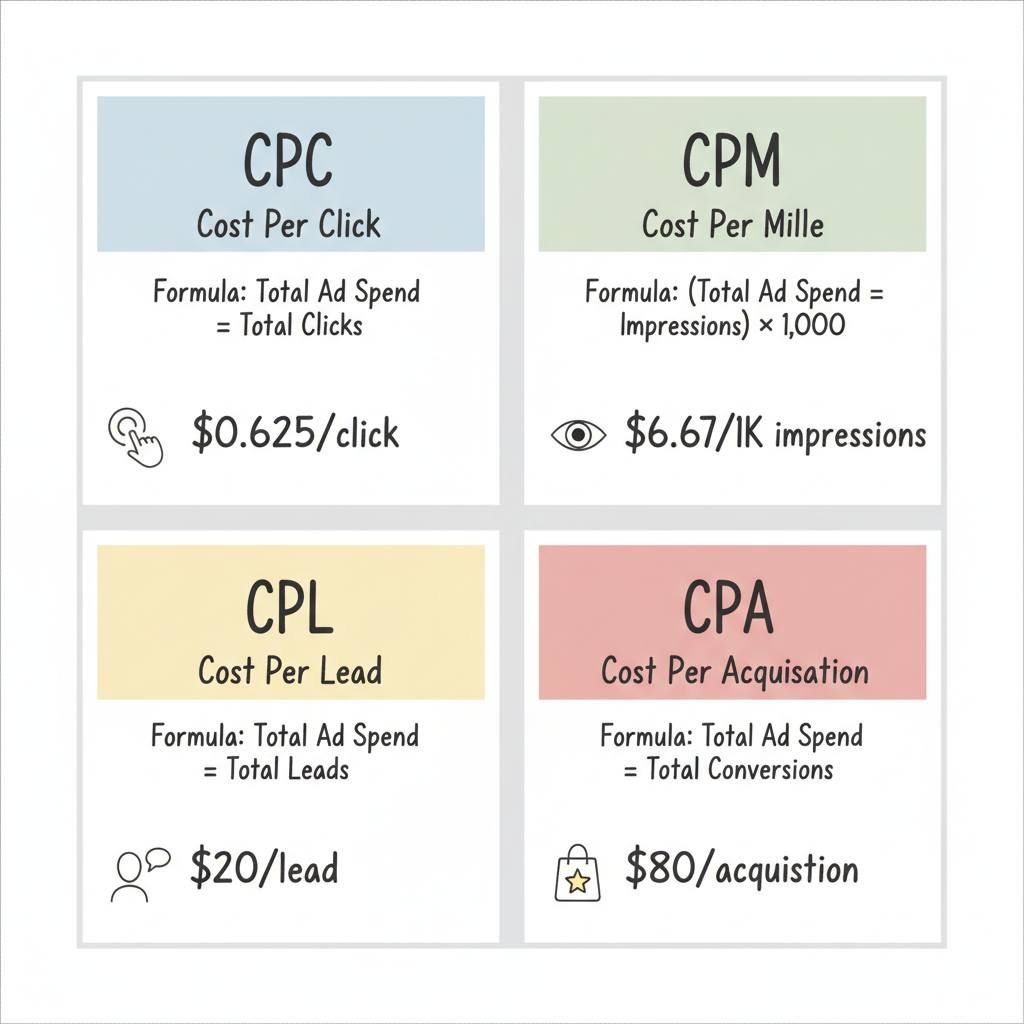
Cost Per Click (CPC) Formula:
CPC = Total Ad Spend ÷ Total ClicksExample: If you spend $500 and receive 800 clicks:
Cost Per Mille (CPM) Formula:
CPM = (Total Ad Spend ÷ Total Impressions) × 1,000Example: If you spend $500 and receive 75,000 impressions:
Cost Per Lead (CPL) Formula:
CPL = Total Ad Spend ÷ Total Leads GeneratedExample: If you spend $1,000 and generate 50 leads:
Cost Per Acquisition (CPA) Formula:
CPA = Total Ad Spend ÷ Total ConversionsExample: If you spend $2,000 and make 25 sales:

Before you can estimate costs accurately, you need to understand what each metric means and how it affects your budget. This becomes especially important when deciding between Google Ads vs Facebook Ads for your campaigns.
CPC measures what you pay each time someone clicks your ad. The average Facebook CPC is $0.62 in 2026, though this varies significantly by industry and targeting.
Industry | Average CPC |
Finance & Insurance | $1.50 - $3.00 |
Legal Services | $1.30 - $2.50 |
B2B | $1.00 - $2.00 |
E-commerce | $0.45 - $0.80 |
Retail | $0.40 - $0.70 |
When to focus on CPC: Use CPC when your goal is driving traffic or specific actions like purchases or sign-ups. CPC campaigns charge you only when someone clicks, making them ideal for conversion-focused objectives. If you're in e-commerce, understanding Google Ads vs Facebook Ads for e-commerce can help you optimize your CPC strategy.
CPM measures what you pay per 1,000 ad impressions. The average Facebook CPM is $11.62, ranging from $5 to $18 depending on your audience and placement.
Campaign Objective | Average CPM |
Reach | $5 - $7 |
Brand Awareness | $5 - $8 |
Engagement | $4 - $6 |
Traffic | $6 - $9 |
Lead Generation | $9 - $13 |
Conversions | $10 - $15 |
When to focus on CPM: Use CPM for awareness campaigns where you want maximum visibility. You pay for impressions regardless of clicks, making it cost-effective for brand exposure. Understanding Facebook ads targeting can help you lower your CPM through better audience selection.
CTR measures the percentage of people who click your ad after seeing it. Higher CTR signals strong ad relevance and typically leads to lower costs.
CTR = (Total Clicks ÷ Total Impressions) × 100The average Facebook CTR is around 0.9-1.0%. A higher CTR improves your Quality Score, often leading to lower CPC. Learning how to create Facebook ads for beginners can help you craft compelling ads that improve your CTR.
Conversion rate measures what percentage of visitors complete your desired action.
Conversion Rate = (Total Conversions ÷ Total Clicks) × 100Industry averages range from 2-5% for e-commerce and 5-15% for lead generation campaigns. Knowing how to calculate ROI on Facebook ads helps you determine if your conversion rate justifies your ad spend.
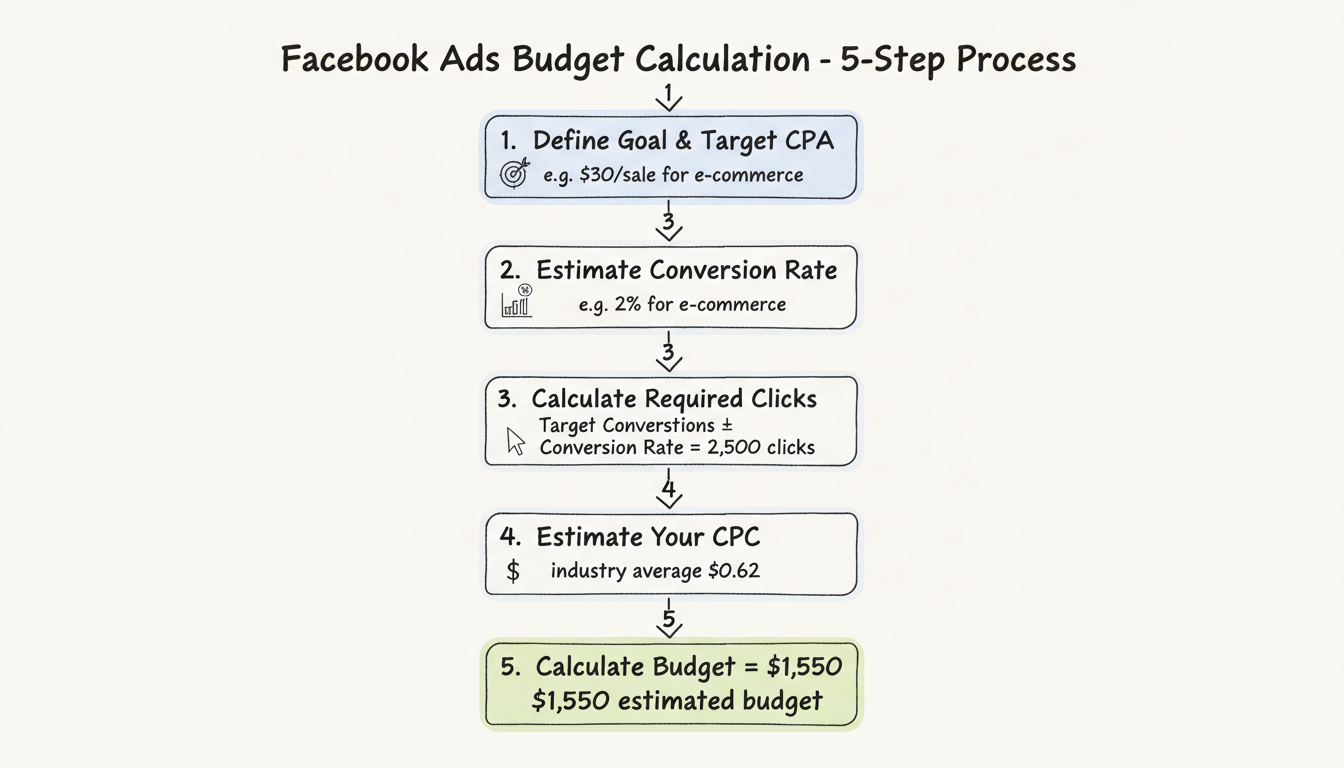
Follow this step-by-step process to calculate your Facebook advertising budget based on your goals. Whether you're running Facebook ads as an agency or for your own business, these calculations remain consistent.
Start with what you want to achieve and how much you can afford to pay per result.
Example scenarios:
Use industry benchmarks or historical data if available:
Business Type | Typical Conversion Rate |
E-commerce | 2% - 4% |
Lead Generation | 5% - 15% |
SaaS/Software | 3% - 7% |
Local Services | 8% - 12% |
Required Clicks = Target Conversions ÷ Conversion RateExample: If you want 50 sales and expect a 2% conversion rate:
Use industry benchmarks to estimate your cost per click. The average is $0.62, but adjust based on your industry. If you're exploring Meta Advantage Plus campaigns, you may see different CPC patterns due to automated optimization.
Budget = Required Clicks × Estimated CPCExample: 2,500 clicks × $0.62 = $1,550 estimated budget
Use this table to estimate monthly budgets for common goals:
Goal | Target Results | Est. CPC | Est. Conv. Rate | Monthly Budget |
50 sales | 2,500 clicks | $0.70 | 2% | $1,750 |
100 leads | 1,000 clicks | $0.90 | 10% | $900 |
10,000 reach | 10K impressions | $10 CPM | N/A | $100 |
500 website visits | 500 clicks | $0.65 | N/A | $325 |
Once you've calculated your baseline costs, use these strategies to improve efficiency. These tactics work whether you're working with a Facebook ads marketing agency or managing campaigns in-house.
A higher Click-Through Rate signals ad platforms that your ad is relevant, often leading to lower costs. Test different:
Overly broad targeting wastes budget on unqualified users. Overly narrow targeting limits delivery. Find the balance by:
Understanding what are Meta ads and their targeting capabilities can help you optimize audience selection.
Letting Meta optimize across Facebook, Instagram, Stories, and Audience Network typically delivers the lowest overall CPM. If you're wondering whether you can run ads on Instagram without Facebook, automatic placements handle both seamlessly.
Ad fatigue increases costs over time. Creative performance typically peaks in weeks 1-2, then declines. Rotate 3-5 ad variants to maintain performance.
If your CPA is too high, try setting a cost cap at 80-90% of your current average. Increase gradually if you're under-delivering. Ensure your ads comply with Meta ads policy to avoid delivery issues that can increase costs.
The average Facebook CPC is $0.62 in 2026, with a typical range of $0.51 to $0.77. However, this varies significantly by industry—finance and legal can exceed $2.00 per click, while e-commerce often sees $0.40-0.70.
To calculate your budget: (1) Define your target cost per acquisition, (2) Estimate your conversion rate, (3) Calculate required clicks (target results ÷ conversion rate), (4) Multiply by your expected CPC. For example, 100 leads at 10% conversion rate = 1,000 clicks × $0.90 CPC = $900 budget.
A good CPM for Facebook ads in 2026 is between $5 and $10. CPMs under $5 are excellent, $10-15 is average, and anything over $15 suggests room for optimization. Your actual CPM depends on industry, objective, and audience targeting.
To convert CPM to estimated CPC, you need your expected CTR. Use this formula: CPC = CPM ÷ (CTR × 10). For example, with a $10 CPM and 1% CTR: CPC = $10 ÷ (0.01 × 10) = $1.00 per click.
By submitting this form, you agree to our Privacy Policy and Terms & Conditions.


