February 19, 2026


If you're planning to advertise on Facebook this year, you're probably wondering: how much do Facebook ads cost? The short answer is that most businesses pay between $0.50 and $3.00 per click, with the average cost per click (CPC) sitting around $1.14 globally in 2026.
But that number only tells part of the story. Your actual Facebook advertising costs depend on your industry, campaign objectives, audience targeting, ad quality, and timing. A retail brand might pay $0.45 per click while a financial services company could pay over $3.77 for the same action.
This guide breaks down every cost metric you need to know—CPC, CPM, CPL, and CPA—with real 2026 benchmarks by industry. You'll also learn what factors drive costs up (and down) and nine proven strategies to reduce your Facebook ad spend while maintaining results.
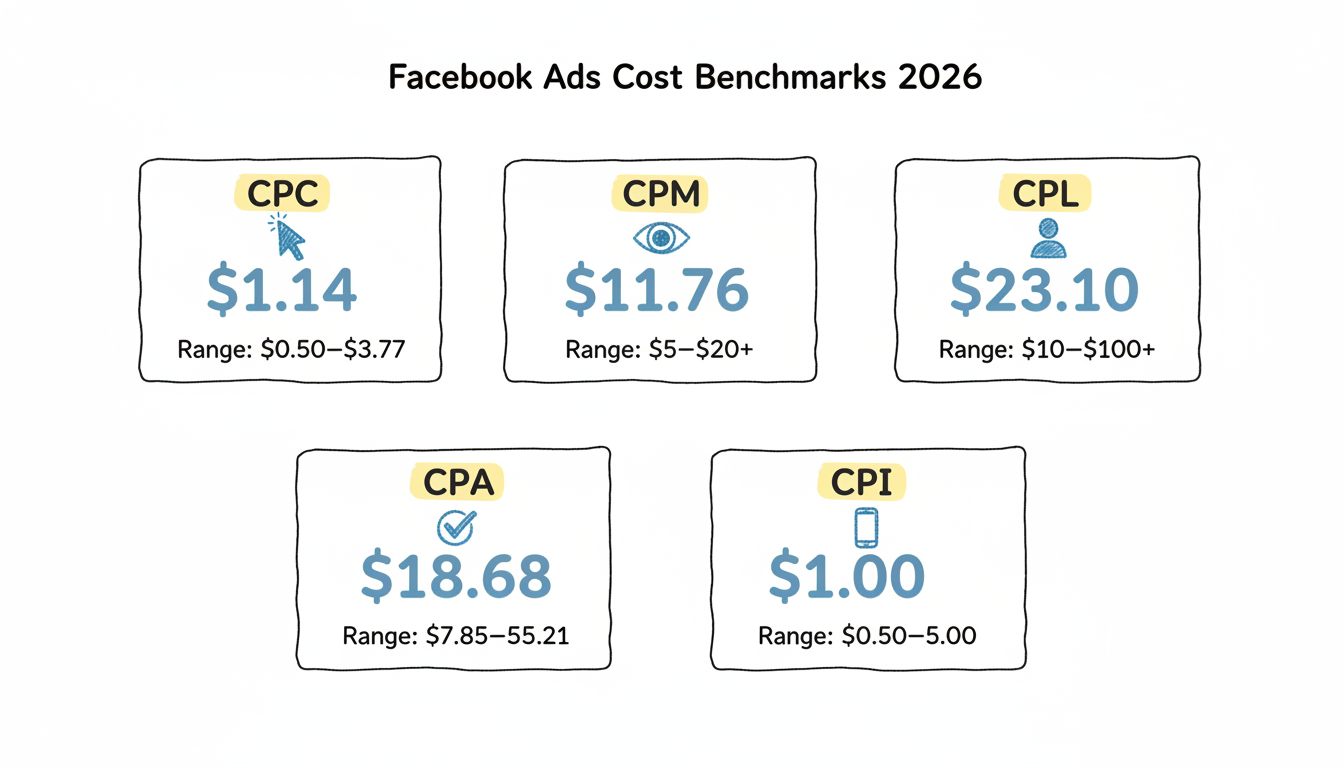
Facebook uses an auction-based pricing model, which means your costs fluctuate based on competition, audience demand, and ad quality. Here's what advertisers are paying on average in 2026:
Metric | Average Cost | Typical Range |
Cost Per Click (CPC) | $1.14 | $0.50 – $3.77 |
Cost Per 1,000 Impressions (CPM) | $11.76 | $5 – $20+ |
Cost Per Lead (CPL) | $23.10 | $10 – $100+ |
Cost Per Action (CPA) | $18.68 | $7.85 – $55.21 |
Cost Per Install (CPI) | $1.00 | $0.50 – $5.00 |
Source breakdown by campaign type:
For traffic campaigns, WordStream reports the average CPC across all industries is $0.83, with an average click-through rate of 1.51%.
For lead generation campaigns, costs are higher. The average CPC jumps to $1.92, with an average conversion rate of 8.25% and cost per lead of $23.10. Many businesses find it helpful to use a Facebook ads ROI calculator to project returns at these rates.
CPM (cost per thousand impressions) varies significantly throughout the year. According to SuperAds benchmarks, Facebook CPMs in the United States:
Q4 is consistently the most expensive period, with CPMs averaging about 15% higher than Q3 due to holiday competition. If you're budget-constrained, consider running awareness campaigns in Q1 when CPMs are at their lowest.
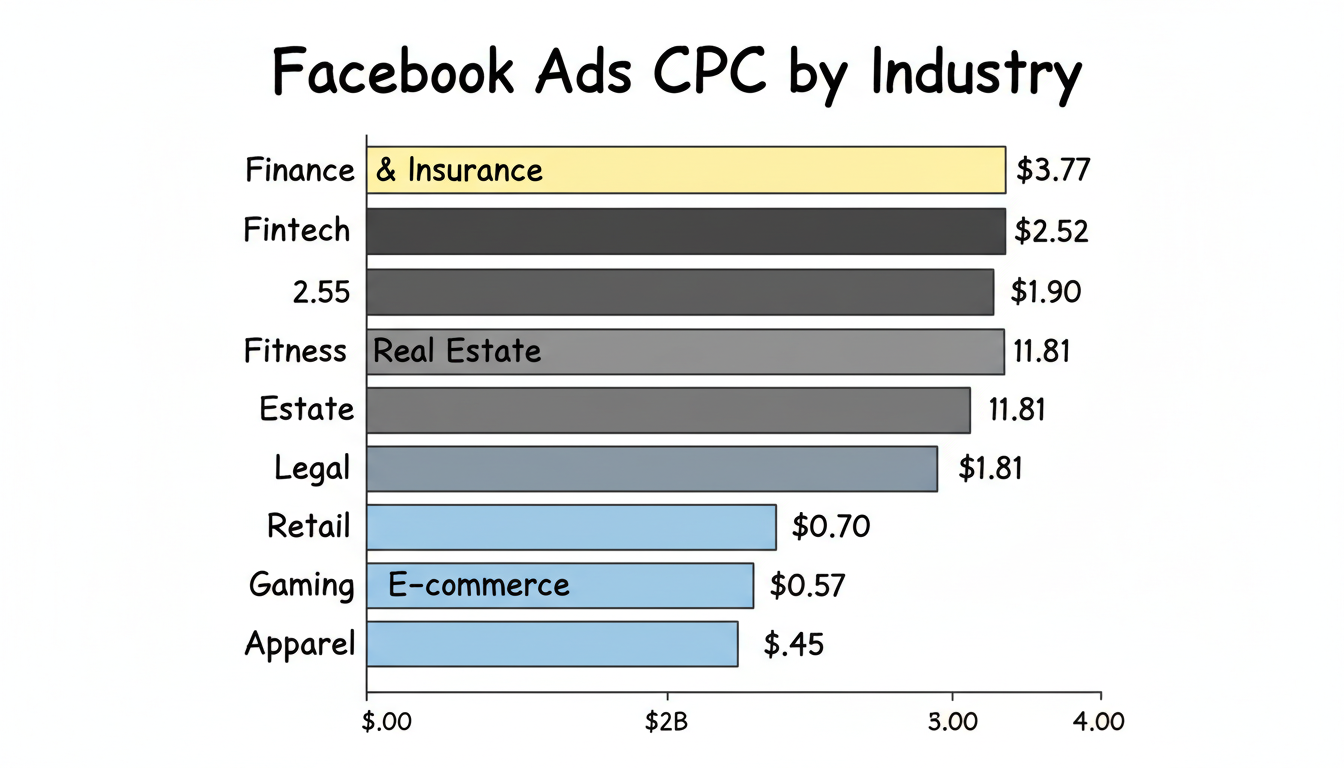
Your industry has a massive impact on what you'll pay per click. Here's a comprehensive breakdown of Facebook CPC by industry in 2026:
Industry | Average CPC | Average CPM | Average CPA |
Finance & Insurance | $3.77 | $11.37 | $41.43 |
Fintech | $2.55 | $19.35 | $40.00 |
B2B | $2.52 | $22.50 | $23.77 |
Fitness | $1.90 | $14.02 | $13.29 |
Real Estate | $1.81 | $10.97 | $16.92 |
Legal Services | $1.81 | $11.31 | $28.70 |
Beauty | $1.81 | $13.91 | $25.79 |
Digital Marketing | $1.38 | $7.19 | $23.10 |
Healthcare | $1.32 | $5.78 | $12.31 |
Technology | $1.27 | $9.98 | $55.21 |
Education | $1.06 | $5.31 | $7.85 |
Retail | $0.70 | $1.38 | $21.47 |
Travel & Tourism | $0.63 | $9.89 | $22.50 |
Gaming | $0.57 | $8.90 | $29.00 |
E-commerce | $0.45 | $5.33 | $45.00 |
Automotive | $0.45 | $6.81 | $43.84 |
Apparel | $0.45 | $5.99 | $10.98 |
Key insights from this data:
For eCommerce advertisers specifically, the average CPC is $1.07—roughly 5% below the global average—thanks to efficient optimization through dynamic product ads. Understanding ecommerce Meta ads strategy can help drive these costs even lower.
Lead generation costs vary dramatically depending on your target market. Here are 2026 CPL benchmarks across major industries:
Industry | Average Cost Per Lead |
Higher Education | $982 |
Financial Services | $653 |
Legal Services | $649 |
Oil & Gas | $637 |
Manufacturing | $553 |
Staffing & Recruiting | $497 |
Real Estate | $448 |
Automotive Services | $283 |
B2B SaaS | $237 |
All Industries Average | $198 |
HVAC | $92 |
E-Commerce | $91 |
These figures represent blended averages across paid and organic channels. For Facebook-specific lead gen campaigns, WordStream data shows the average CPL is $23.10 when using Meta's native Lead Gen objective.
However, industry research from Axzlead shows Facebook/Instagram ads average around $21.98 per lead, making them significantly more affordable than LinkedIn ads ($80-$250+ for B2B).
Why some industries pay more:
Many businesses seeking to optimize lead costs work with a Facebook ads marketing agency that specializes in their vertical.
How much should you budget for Facebook ads per month? Understanding how much to run ads on Facebook depends on your goals, but here are typical monthly spend ranges:
Business Size | Monthly Budget Range | Notes |
Small Business (Testing) | $500 – $1,000 | Minimum to gather meaningful data |
Small Business (Active) | $2,000 – $5,000 | Average for most small businesses |
Competitive Markets | $3,000 – $10,000 | Home services, legal, real estate |
Mid-Market Companies | $10,000 – $50,000 | Scaling proven campaigns |
Enterprise | $50,000+ | Multiple campaigns and objectives |
According to AgencyAnalytics data, the median monthly Facebook Ads spend across all industries is $1,051.86. However, this varies significantly:
If you're just getting started, here's a practical framework:
For testing purposes, budget at least $1,000-$2,000 to gather enough data for optimization. Campaigns under $1,000 per month often struggle to generate meaningful data for algorithmic learning. For those wondering do Facebook ads cost money, yes—but the investment can deliver strong returns when properly managed. Understanding Facebook ads cost per day helps you allocate your monthly budget effectively.
Your actual Facebook ad costs are determined by multiple variables. Understanding these factors helps you control spend more effectively.
Narrow, high-value audiences cost more because multiple advertisers are bidding for the same users. Facebook ads targeting Fortune 500 CTOs costs significantly more than reaching general consumers.
What to do: Balance specificity with scale. Audiences of 2-5 million people typically offer lower CPMs than highly targeted groups of 500K.
Facebook rewards ads that resonate with their audience. High-quality, relevant ads receive better placement at lower costs. Meta tracks three quality metrics:
Ads with "Above Average" quality rankings consistently achieve lower CPCs and CPMs. Studying Meta ads examples can help you understand what high-quality creative looks like.
Your chosen Facebook ads objectives directly impact costs because it determines how Facebook optimizes delivery:
Objective | Typical CPC | Best For |
Brand Awareness | N/A (CPM-based) | Top-of-funnel reach |
Traffic | $0.83 | Website visits |
Engagement | $0.50-$1.50 | Social proof |
Lead Generation | $1.92 | Direct lead capture |
Conversions | $1.50-$3.00 | Sales and signups |
Choosing the wrong objective wastes budget. If you want leads, use the Lead Gen objective—not Brand Awareness. Many advertisers learning how to create Facebook ads for beginners struggle with objective selection initially.
Facebook offers several Meta ads bidding strategy approaches:
Manual bidding at 80% of your current CPM can reduce costs, but requires careful monitoring and adjustment if delivery drops.
Ad costs fluctuate predictably throughout the year:
Period | Relative Cost | Notes |
January | Lowest | Post-holiday drop |
Q1 | Low | Advertiser budget resets |
Q2-Q3 | Moderate | Steady competition |
October-December | Highest | Holiday shopping surge |
November | Peak | CPMs can spike 38%+ |
If you're budget-constrained, avoid Q4 when possible or allocate extra budget for the increased competition.
Where your ads appear affects cost and performance:
Using Automatic Placements lets Facebook optimize delivery across platforms, often reducing overall costs compared to manual placement selection. If you want to run ads Instagram without Facebook, you can, but automatic placements typically yield better results. Working with an Instagram ads agency can help optimize placement strategies.
Creative quality significantly impacts performance and cost. Reviewing Meta ads examples can provide inspiration for high-performing creative formats:
Creative fatigue sets in after 2-3 weeks, causing CPMs to rise. Plan to refresh creatives regularly. Understanding Meta ads creative strategy helps maintain fresh, engaging content.
Reducing Facebook ad costs while maintaining results requires strategic optimization. Here are nine proven tactics based on current industry best practices.
Selecting the wrong objective is one of the most expensive mistakes advertisers make. Your objective tells Facebook who to show your ads to:
Each objective optimizes for different user behaviors. Misalignment between your goal and objective means you're paying for actions that don't matter. Facebook ads for beginners often struggle with this decision, which is why many choose to work with the best Facebook ads agencies for guidance.
The more relevant your audience, the higher your engagement—and the lower your costs. Facebook rewards relevant ads with cheaper rates.
Tactics that work:
Learning how to run effective Facebook ads requires mastering audience segmentation. Many businesses find value in partnering with a specialized Facebook ads agency near me for local market expertise.
Frequency is how many times each person sees your ad. High frequency causes "ad fatigue," where users ignore or hide your ads—both of which increase costs.
Best practices:
Never assume your first version is your best. Testing different elements can significantly improve performance:
Change one variable at a time to identify what drives results. Even small CTR improvements can meaningfully reduce your CPC. Studying Meta ads creative strategy can help optimize your testing approach. Understanding how to run Facebook ads at scale requires systematic testing.
Video consistently outperforms static images for most objectives. According to Social Rails research, video typically achieves:
Keep videos under 30 seconds with captions for sound-off viewing. Mobile-first, vertical formats work best for Stories and Reels.
Users who've already interacted with your brand convert at higher rates. Retargeted customers are 70% more likely to convert than cold audiences.
Retargeting audiences to build:
Those learning how to run Facebook ads for business should prioritize retargeting as a cost-efficient strategy.
Markets shift quickly, and manual optimization can't keep pace. Automated rules help you:
Example rule: "Pause ad set if Spend > $100 and Purchases < 1"
Avoid peak competition periods when possible. CPMs in January are typically 30%+ lower than November peaks.
Timing strategies:
Facebook considers post-click experience when determining ad quality. A poor landing page increases costs because users bounce quickly.
Optimization checklist:
Understanding how to increase ROI Facebook ads means optimizing the entire funnel, not just the ad itself.
With average CPCs around $1.14 and CPLs around $23, Facebook remains one of the most cost-effective digital advertising platforms—especially compared to Google Ads, where average CPCs are $2.69.
Return on ad spend (ROAS) measures revenue generated per dollar spent on advertising. According to Varos data, the median ROAS on Facebook Ads is 2.24 as of early 2025—meaning advertisers earn $2.24 for every $1 spent. Understanding what is good ROI Facebook ads helps you benchmark performance. Calculating Facebook ads ROI accurately is essential for campaign optimization.
Industry ROAS benchmarks:
Step 1: Calculate total investment
Step 2: Measure conversion value
Step 3: Calculate ROI
Step 4: Calculate ROAS
A ROAS of 3.0 or higher is generally considered strong for most businesses, though acceptable thresholds vary by margin structure. For more guidance, see how to calculate ROI Facebook ads.
How does Facebook stack up against alternatives?
Platform | Average CPC | Average CPL | Best For |
Facebook/Instagram | $1.14 | $21.98 | B2C, visual products, retargeting |
Google Search Ads | $2.69 | $70.11 | High-intent searches |
LinkedIn Ads | $5.00+ | $80-$250 | B2B, professional targeting |
TikTok Ads | $1.00-$2.00 | $20-$50 | Gen Z, entertainment brands |
For most businesses—especially those selling visual products or targeting consumers—Facebook offers better cost efficiency than Google Ads at roughly 40% lower CPCs. For detailed comparisons, see Facebook ads vs Google ads cost, Google ads vs Facebook ads which is better, Facebook ads vs Instagram ads vs Google ads, or Facebook ads vs Google ads vs TikTok ads. E-commerce businesses should review Google ads vs Facebook ads ecommerce for platform-specific insights.
Many businesses choose to partner with specialized agencies to maximize ROI and reduce wasted spend. Agency pricing and structures vary significantly based on location, expertise, and service level.
When evaluating Facebook ads agency pricing, you'll typically encounter three models:
White label Facebook ads agency partnerships offer another option for marketing firms serving clients.
Location can impact both cost and expertise:
Working with a Facebook agency partner can provide access to premium features through a Facebook agency account or Meta agency ad account. Some agencies offer Facebook agency ad account rent services, though understanding how to get Meta agency ad account access directly is valuable. A Meta ad agency account can provide higher spending limits and dedicated support.
For those considering starting a Facebook ads agency, understanding pricing structures and client management is essential. Agencies can also provide Meta ad agency services beyond basic campaign management.
For advertisers looking to scale beyond basic campaigns, several advanced approaches can improve performance.
Meta Advantage Plus campaigns use machine learning to automate targeting, placements, and creative optimization. These campaigns can reduce CPAs by 10-20% compared to manual setup for many advertisers.
Developing a comprehensive Meta ads strategy involves coordinating multiple campaign types:
Meta continuously updates its advertising platform. Monitoring Meta ads updates and understanding Meta ads policy requirements helps maintain compliant, effective campaigns.
Investing in education improves campaign performance:
Different objectives require different approaches:
Different business models require tailored approaches:
Platform comparisons help inform channel selection:
Facebook's minimum daily budget is $1 per day for impressions-based campaigns and $5 per day for conversion campaigns. However, campaigns under $20/day rarely gather enough data for meaningful optimization. Most advertisers spend $20-$100/day during testing phases.
$100 is enough for initial testing but won't provide conclusive results. With an average CPC of $1.14, $100 yields approximately 85-90 clicks. If your conversion rate is 8%, that's only 7-8 conversions—too few for statistical significance. Budget at least $500-$1,000 for meaningful testing.
Yes, $1,000 is a reasonable starting budget for most small businesses. This allows approximately 875 clicks at average CPC, which should generate 70+ leads or conversions at typical rates. Many small businesses spend $2,000-$5,000 monthly for active campaigns. Working with a Facebook ads agency small business can help maximize this budget.
Common reasons for high costs include:
Review your Quality Ranking in Ads Manager and refresh creative if scores are below average. Consider consulting Facebook ads management agency experts if costs remain high.
The average CPM (cost per 1,000 impressions) is $11.76 globally in 2026. This ranges from $5-8 for entertainment and retail to $20+ for finance and SaaS. U.S. advertisers typically pay 9-16% more than global averages. Understanding Meta advertising cost structures helps with budgeting.
A "good" CPC depends on your industry and campaign goals. The global average is $1.14, but:
Compare your CPC to your industry benchmarks, not overall averages. Use a Facebook ads cost calculator to estimate your expected performance.
By submitting this form, you agree to our Privacy Policy and Terms & Conditions.


