February 19, 2026


Understanding your Facebook ads ROI is the difference between wasting money and building a profitable advertising channel. While many advertisers focus on vanity metrics like impressions and clicks, the only metric that truly matters is whether your campaigns generate more revenue than they cost.
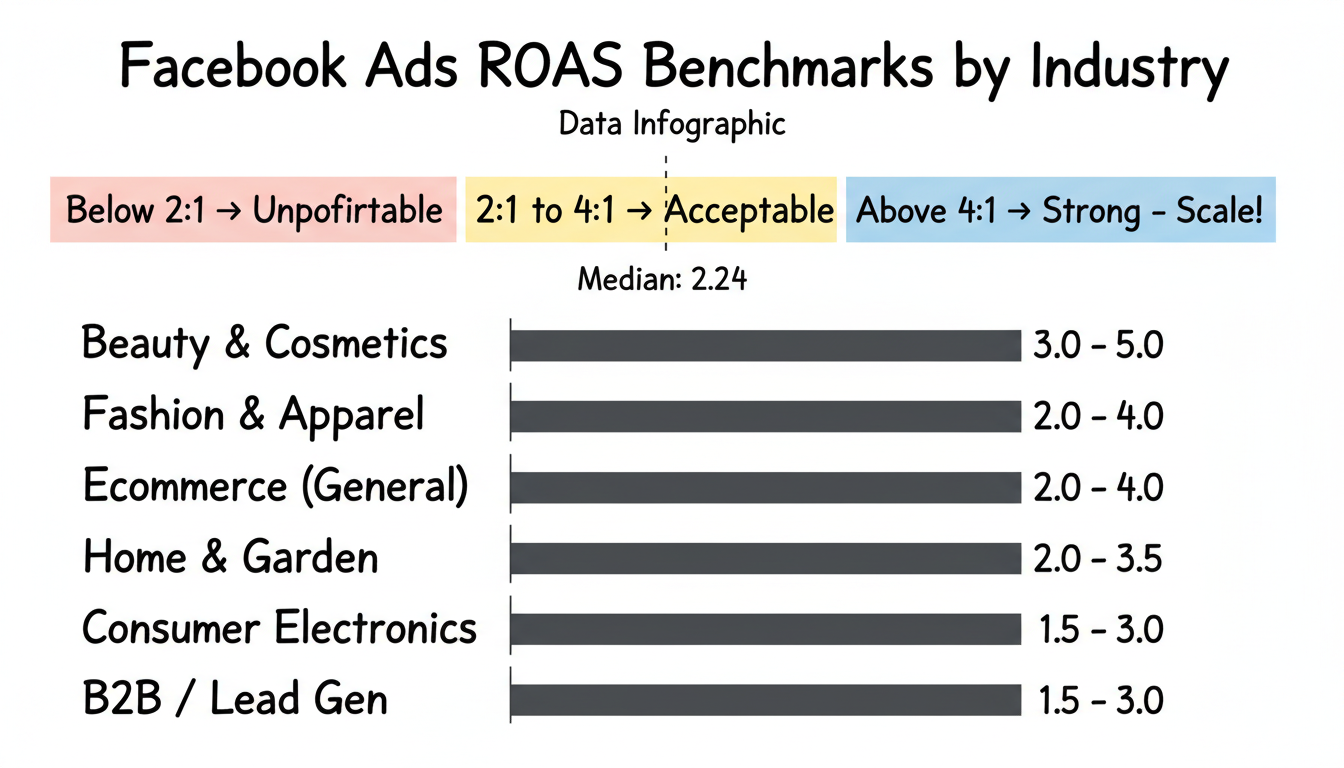
According to Varos benchmark data, the median ROAS (Return on Ad Spend) on Facebook Ads is 2.24 as of early 2025—meaning the typical advertiser earns $2.24 for every $1 spent. But that number varies dramatically by industry, creative quality, and optimization strategy.
This guide shows you exactly how to calculate your Facebook ads ROI, what benchmarks to target, and proven tactics to improve your returns.
There are two primary metrics for measuring Facebook advertising profitability: ROI (Return on Investment) and ROAS (Return on Ad Spend). While often used interchangeably, they measure slightly different things.
ROI measures your total profit relative to your total investment:
ROI = (Revenue - Total Costs) ÷ Total Costs × 100%Total costs include:
Example calculation:
ROI = ($15,000 - $7,500) ÷ $7,500 × 100% = 100%
A 100% ROI means you doubled your investment.
ROAS (Return on Ad Spend) is simpler—it only considers ad spend:
ROAS = Revenue ÷ Ad SpendExample calculation:
ROAS = $15,000 ÷ $5,000 = 3.0 (or 3:1)
A ROAS of 3.0 means you earn $3 for every $1 spent on ads.
Use ROAS for day-to-day campaign optimization and comparing ad performance. Use ROI for business-level decisions about whether Facebook advertising is profitable overall.
Most advertisers track ROAS because it's reported directly in Meta Ads Manager and allows quick performance comparisons. However, a "good" ROAS depends entirely on your profit margins—understanding your facebook ads cost per day helps contextualize these returns.
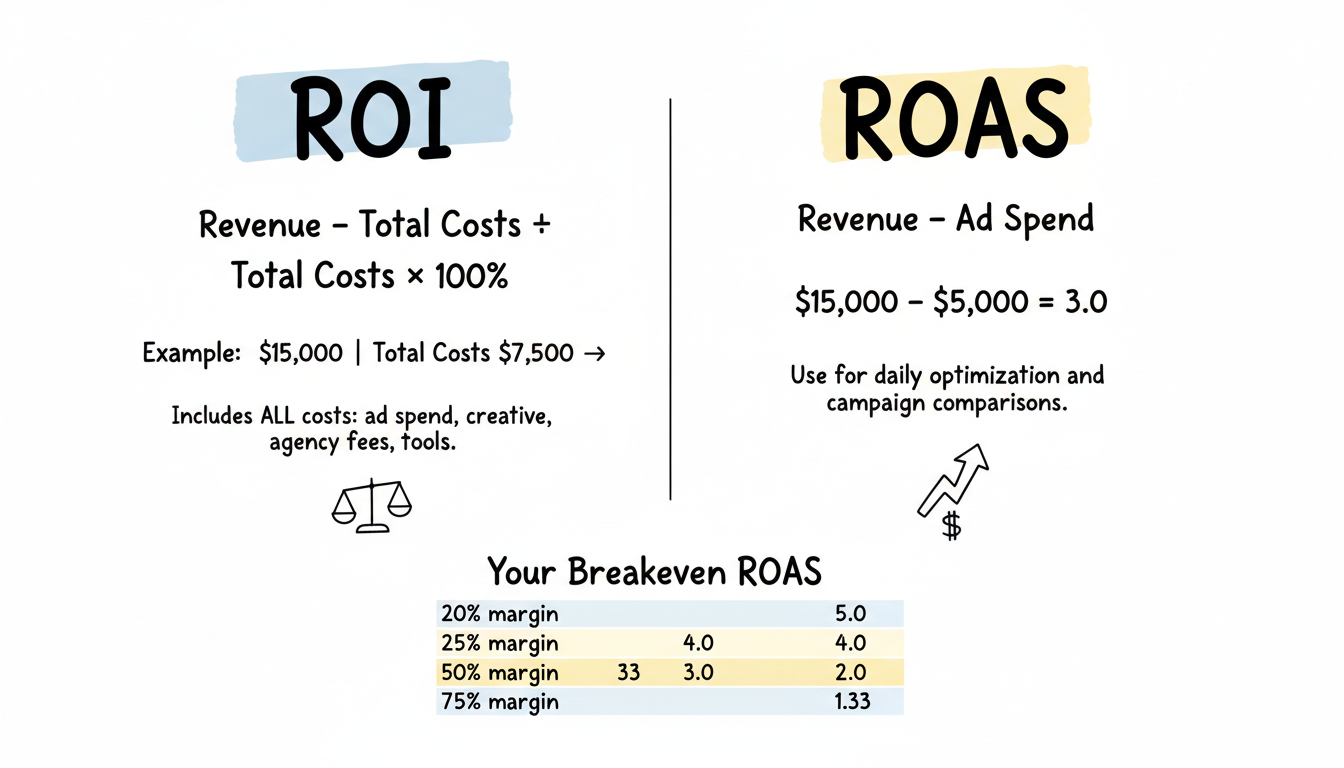
Your breakeven ROAS is the minimum return needed to cover costs. The formula depends on your profit margin:
Breakeven ROAS = 1 ÷ Profit MarginExamples by profit margin:
Profit Margin | Breakeven ROAS |
20% | 5.0 |
25% | 4.0 |
33% | 3.0 |
50% | 2.0 |
75% | 1.33 |
If your profit margin is 25%, you need a ROAS of at least 4:1 just to break even. Anything above that is actual profit. Many advertisers use a facebook ads cost calculator to estimate these thresholds before launching campaigns.
What constitutes a "good" Facebook ads ROI varies significantly by industry, business model, and campaign objective.
Based on industry benchmark data from multiple sources:
Industry | Typical ROAS Range |
Ecommerce (General) | 2.0 - 4.0 |
Fashion & Apparel | 2.5 - 4.5 |
Consumer Electronics | 1.5 - 3.5 |
Beauty & Cosmetics | 3.0 - 5.0 |
Home & Garden | 2.0 - 3.5 |
B2B / Lead Gen | 1.5 - 3.0 (measured differently) |
According to industry standards:
Remember: the median ROAS across all Facebook advertisers is approximately 2.24. If you're above that, you're performing better than half of all advertisers.
Beyond ROAS, monitor these metrics from 2025-2026 benchmark data:
Metric | Average Range |
CPC (Cost Per Click) | $0.50 - $2.00 |
CPM (Cost Per 1,000 Impressions) | $5.00 - $15.00 |
CTR (Click-Through Rate) | 0.90% - 1.60% |
Conversion Rate | 2% - 6% |
Understanding your facebook ads cost per impression helps you identify whether high costs are due to bidding issues or creative performance.
Multiple variables influence your Facebook ads return on investment:
Reaching the wrong people guarantees poor ROI regardless of your creative or offer. Factors include:
According to Meta's own research, creative quality accounts for up to 56% of ad performance variance. High-performing creative includes:
Developing a strong meta ads creative strategy is essential for maximizing ROI across all campaign objectives.
Your ads can perform perfectly, but poor landing pages kill ROI. Industry data shows that optimizing landing pages alongside ads can dramatically improve conversion rates.
The best-targeted, best-designed campaign will underperform if your offer isn't compelling. Consider:
Cold audiences (awareness) naturally have lower immediate ROAS than retargeting campaigns. A healthy ad account needs both:
When deciding between platforms, understanding facebook ads vs google ads can help you allocate budget to the channel best suited for each funnel stage.
Ad costs fluctuate based on competitive demand. Q4 (October-December) typically sees 20-50% higher CPMs due to holiday advertising competition. Your facebook ads cost per month can vary dramatically based on these seasonal patterns.
These proven tactics consistently improve Facebook advertising returns:
You can't improve what you can't measure. Ensure proper setup of:
Run structured creative tests rather than random experiments:
Start broad and let Meta's algorithm optimize, then:
Common landing page improvements that boost ROI:
Retargeting typically delivers 3-5x higher ROAS than cold prospecting. Build retargeting audiences from:
For ecommerce businesses, implementing an ecommerce meta ads strategy that emphasizes retargeting can significantly improve overall ROI.
Test different bidding approaches:
Understanding your meta ads bidding strategy options is crucial for controlling costs while maintaining performance at scale.
Avoid performance drops when scaling:
Once you've found profitable campaigns, implementing a meta ads scaling strategy ensures you can grow spend without sacrificing ROI.
Use this framework to calculate your Facebook ads ROI:
Step 1: Gather Your Data
Step 2: Calculate ROAS
ROAS = Revenue ÷ Ad Spend = $____ ÷ $____ = ____Step 3: Calculate True ROI
Total Costs = Ad Spend + Creative + Agency + Tools = $____
Profit = Revenue - Total Costs = $____
ROI = Profit ÷ Total Costs × 100% = ____%
Step 4: Compare to Breakeven
Your Profit Margin: ____%
Breakeven ROAS: 1 ÷ Margin = ____
Your ROAS vs. Breakeven: ____ vs. ____
Profitable? Yes / NoA "good" Facebook ads ROI depends on your profit margins and business model. Generally, a ROAS above 4:1 indicates strong performance, while 2:1 to 4:1 is acceptable with room to optimize. The median ROAS across all advertisers is approximately 2.24, so anything above that means you're outperforming half of all Facebook advertisers.
Most campaigns need 30-90 days to optimize fully. The first 2-4 weeks involve testing audiences and creative to find what works. Expect higher costs during this learning period. Campaigns with larger budgets can exit the learning phase faster due to more data. Many businesses work with a facebook ads management agency to accelerate this optimization process.
Common reasons for declining ROI include: creative fatigue (audiences have seen your ads too many times), increased competition (especially seasonal), audience saturation, algorithm changes, or tracking issues. Start by checking your ad frequency—if it's above 3-4 for cold audiences, you likely need fresh creative. Violations of meta ads policy can also lead to reduced delivery and higher costs.
Use ROAS for daily optimization and campaign comparisons—it's readily available in Meta Ads Manager. Use ROI for business-level decisions about overall profitability, accounting for all costs including agency fees, creative production, and tools.
By submitting this form, you agree to our Privacy Policy and Terms & Conditions.


