February 19, 2026


Knowing what metrics to track is step one. Knowing what numbers represent success—and how to progress from basic tracking to sophisticated measurement—separates organizations with actionable AI search programs from those with dashboards full of data but no direction. This framework provides specific benchmarks by industry, maturity-based KPI targets, and the measurement infrastructure needed at each stage.
The goal isn't measuring everything—it's measuring the right things at the right level of sophistication for your current capabilities.
Organizations progress through distinct measurement maturity stages. Attempting advanced measurement without foundational capabilities wastes resources and produces unreliable data. Implementing a clear AEO optimization metrics framework ensures you track what matters most at each stage.
Stage 1: Foundation (0-6 months)
Capability | Description | Infrastructure Required |
AI traffic identification | Separate AI referrals from organic | GA4 channel grouping |
Basic citation tracking | Manual query sampling | Spreadsheet + query set |
Platform awareness | Know which platforms send traffic | Referral source reports |
Stage 2: Structured (6-12 months)
Capability | Description | Infrastructure Required |
Systematic citation monitoring | Regular sampling across platforms | Monitoring tool or API access |
Competitive benchmarking | Track relative position | Competitor query tracking |
Attribution modeling | Credit AI touchpoints | Multi-touch attribution |
Trend analysis | Track changes over time | Historical data storage |
Stage 3: Advanced (12+ months)
Capability | Description | Infrastructure Required |
Predictive modeling | Forecast AI visibility impact | Statistical analysis capability |
Revenue attribution | Connect citations to revenue | CRM + analytics integration |
Real-time monitoring | Continuous visibility tracking | API-based monitoring system |
Cross-platform optimization | Platform-specific strategy | Per-platform performance data |
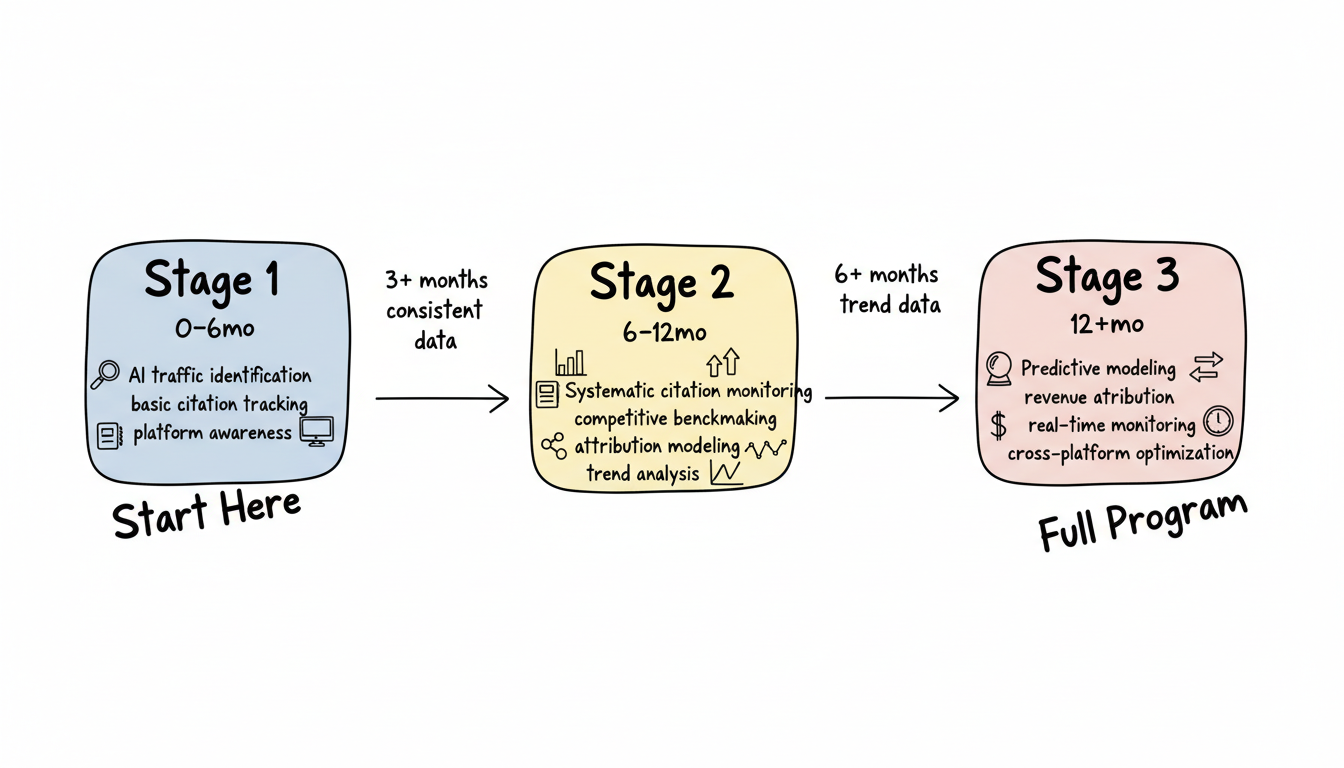
Move to the next stage only when current stage metrics are reliable.
Stage advancement criteria:
From | To | Requirements |
Foundation | Structured | 3+ months consistent data, validated tracking accuracy |
Structured | Advanced | 6+ months trend data, proven attribution model |
Benchmarks vary significantly by industry. Generic targets mislead more than they help. Understanding what is AEO and how it differs from traditional SEO helps contextualize these benchmarks for your organization.
Citation rate measures how often your brand appears when AI responds to relevant queries.
2026 citation rate benchmarks:
Industry | Below Average | Average | Above Average | Top Performer |
B2B SaaS | <5% | 5-15% | 15-30% | >30% |
E-commerce | <3% | 3-10% | 10-20% | >20% |
Professional services | <8% | 8-20% | 20-35% | >35% |
Healthcare information | <4% | 4-12% | 12-25% | >25% |
Financial services | <3% | 3-10% | 10-20% | >20% |
Technology/Software | <6% | 6-18% | 18-32% | >32% |
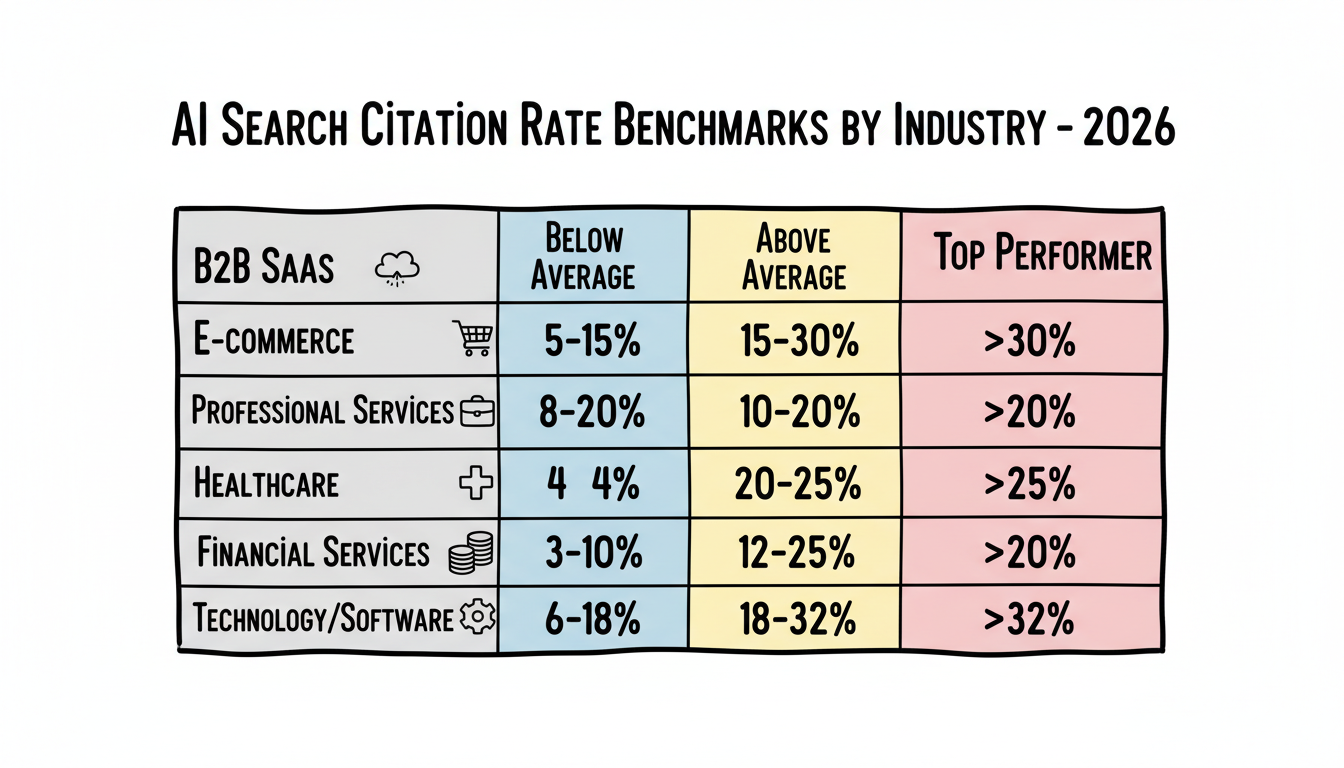
Interpretation notes:
Share of voice measures your citations relative to competitors for the same queries. A comprehensive generative engine content strategy helps you gain competitive visibility in AI-powered search results.
Share of voice targets by market position:
Position | Description | Target SOV | Action Focus |
Market leader | #1-2 in category | 30-45% | Defend and expand |
Strong competitor | #3-5 in category | 15-25% | Target leader's gaps |
Emerging player | #6-10 in category | 5-15% | Niche dominance |
New entrant | Outside top 10 | 2-8% | Establish presence |
AI-referred traffic typically shows higher quality metrics than generic organic.
Expected performance lift from AI traffic:
Metric | AI Traffic vs. Organic Baseline | Top Performer Lift |
Bounce rate | 15-25% lower | 35%+ lower |
Bounce rate | 15-25% lower | 35%+ lower |
Pages per session | 20-40% higher | 50%+ higher |
Session duration | 25-50% longer | 60%+ longer |
Conversion rate | 40-80% higher | 100%+ higher |
If your AI traffic underperforms these benchmarks, investigate landing page alignment with AI-query intent.
Different maturity stages require different KPI focus. Proper AI search KPI goal setting ensures you measure the right indicators for your current maturity level.
Start with metrics that establish baseline understanding.
Foundation KPI set:
KPI | Target Range | Tracking Method | Review Cadence |
AI referral traffic | Establish baseline | GA4 channel report | Weekly |
Platform identification | 100% of AI sources | Referral analysis | Monthly |
Citation presence | Present/absent | Manual query testing | Bi-weekly |
AI traffic conversion | Compare to organic | Conversion tracking | Monthly |
Foundation success criteria:
Add competitive and trend dimensions. Working with a generative engine optimization agency can accelerate your progression through these stages with proven methodologies.
Structured KPI set:
KPI | Target Range | Tracking Method | Review Cadence |
Citation rate | Industry benchmark | Systematic sampling | Weekly |
Share of voice | Market position target | Competitor tracking | Monthly |
Citation sentiment | >80% positive/neutral | Response analysis | Monthly |
Platform coverage | Present on 3+ platforms | Cross-platform checks | Bi-weekly |
Trend direction | Improving trajectory | Historical comparison | Monthly |
Structured success criteria:
Connect AI visibility to business outcomes. Advanced AEO services agency offerings typically include sophisticated attribution models and revenue tracking capabilities.
Advanced KPI set:
KPI | Target Range | Tracking Method | Review Cadence |
Revenue attribution | % of revenue from AI | Attribution modeling | Monthly |
Customer acquisition cost | Compare AI vs. other channels | CAC by source | Quarterly |
Lifetime value | AI-attributed customers | Cohort analysis | Quarterly |
Predictive visibility | Forecast accuracy | Model validation | Quarterly |
Real-time citation alerts | <24hr detection | Monitoring system | Continuous |
Advanced success criteria:
AI search complicates attribution because influence occurs before and without clicks.
Traditional attribution limitations:
Attribution Type | Works For | Fails For AI Because |
Last-click | Direct conversions | Misses AI awareness influence |
First-click | Channel acquisition | Can't track AI exposure |
Linear | Multi-touch journeys | Doesn't account for zero-click |
Position-based | Important touchpoints | AI touchpoint often invisible |
Hybrid attribution model for AI search:
AI-Adjusted Attribution Formula:

Conversion Credit =
  (Direct AI Referral × 0.40) +
  (AI-Influenced Organic × 0.25) +
  (Post-AI Direct × 0.20) +
  (Traditional Organic × 0.15)

Where:
- Direct AI Referral = Traffic from AI platform referrers
- AI-Influenced Organic = Organic clicks on AI Overview queries
- Post-AI Direct = Direct visits within 7 days of AI query exposure
- Traditional Organic = Non-AI organic search
Attribution model by conversion type:
Conversion Type | Recommended Model | AI Credit Weight |
Lead generation | Position-based | 30% to AI touchpoints |
E-commerce | Data-driven | Varies by path analysis |
Content engagement | Time-decay | Recent AI exposure weighted |
High-consideration purchase | Multi-touch | Distributed across journey |
Setup requirements:
Build infrastructure aligned with maturity stage. Leveraging free AEO tools can help you establish foundational tracking before investing in enterprise platforms.
Minimum viable measurement:
Component | Purpose | Recommended Solution |
Analytics platform | Traffic tracking | GA4 (free) |
Query tracking | Citation monitoring | Spreadsheet + manual checks |
Data storage | Historical records | Google Sheets/Airtable |
Estimated setup time: 2-4 hours Ongoing maintenance: 2-3 hours/week
Structured measurement setup:
Component | Purpose | Recommended Solution |
Citation monitoring | Automated tracking | Specialized AEO tool or API |
Competitor tracking | SOV measurement | Same tool + competitor config |
Reporting dashboard | Visualization | Looker Studio/Tableau |
Data warehouse | Centralized storage | BigQuery/Snowflake |
Estimated setup time: 20-40 hours Ongoing maintenance: 4-6 hours/week
Advanced measurement capabilities:
Component | Purpose | Recommended Solution |
Real-time monitoring | Continuous tracking | API-based custom system |
Attribution platform | Revenue connection | CRM + analytics integration |
Predictive analytics | Forecasting | Statistical modeling tools |
Automated alerting | Change detection | Custom or platform alerts |
Estimated setup time: 80-160 hours Ongoing maintenance: 8-12 hours/week
Translate benchmarks into specific targets for your organization. Understanding the relationship between AEO and SEO helps you set realistic targets that complement your existing search optimization efforts.
SMART targets for AI search:
Element | Definition | Example |
Specific | Defined metric and scope | Citation rate for 50 priority queries |
Measurable | Quantifiable outcome | Increase from 12% to 20% |
Achievable | Realistic given resources | Based on industry benchmarks |
Relevant | Aligned with business goals | Supports demand generation |
Time-bound | Clear timeline | Within 6 months |
Recommended review schedule:
Metric Type | Review Frequency | Decision Trigger |
Traffic volume | Weekly | >20% change requires investigation |
Citation rate | Bi-weekly | Consistent decline triggers optimization |
Share of voice | Monthly | Competitive shift requires response |
Revenue attribution | Quarterly | Informs budget allocation |
Benchmark comparison | Quarterly | Adjusts targets for next period |
When metrics miss targets:
Gap Size | Response | Timeline |
<10% below target | Minor optimization | Within current period |
10-25% below target | Strategy adjustment | 2-4 weeks |
>25% below target | Comprehensive review | Immediate |
Build AI search measurement with structure and benchmarks:
Measurement frameworks fail when they're either too simple to provide insight or too complex to maintain. Build for your current stage, validate accuracy before adding complexity, and let benchmarks—not aspirations—guide your targets. For organizations ready to scale their measurement capabilities, exploring generative engine optimization services can provide the infrastructure and expertise needed to advance through maturity stages efficiently.
By submitting this form, you agree to our Privacy Policy and Terms & Conditions.


